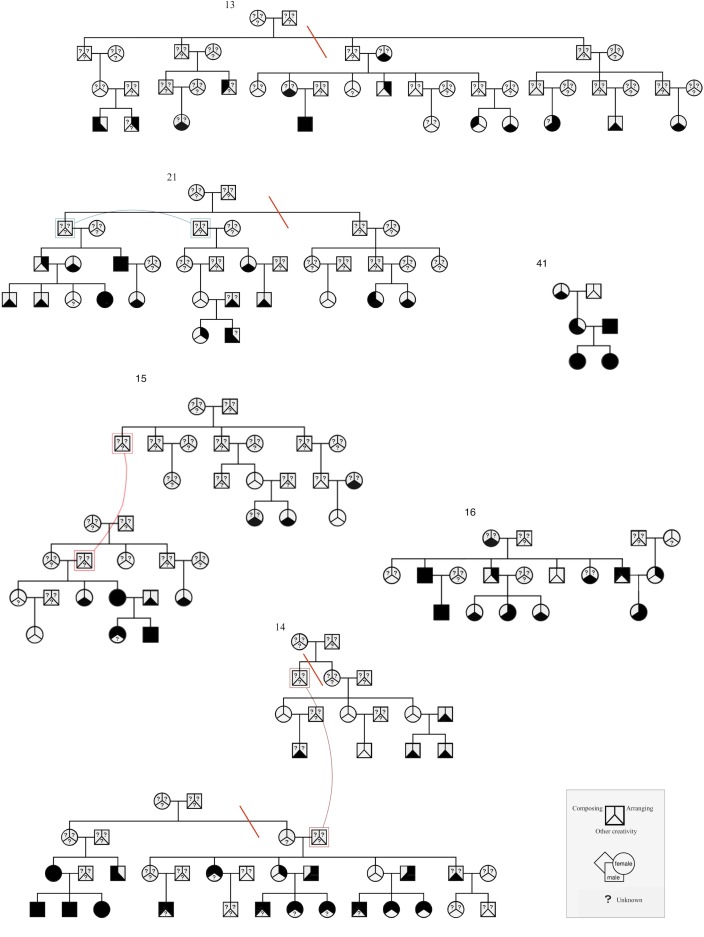
Fig 1. Examples of the pedigrees in the study.
Arranging, composing and other creativity answers are shown for every individual; black denotes “yes” and white “no”. The question marks denote missing phenotypes. Individuals shown twice are linked with a coloured curve. Orange lines mark where the three most complex pedigrees (#13, #14 and #21) were split for the Merlin linkage analyses. The complexity is caused by the number of individuals and missing phenotypes in a pedigree. In some of the families, as in #14 and #41, music-related creative activities were common, whereas most of the families showed only a few individuals who arranged and/or composed music.

