
FIGURE 2. Age- specific fertility rates for women from the study cohort with or without a CRC diagnosis.
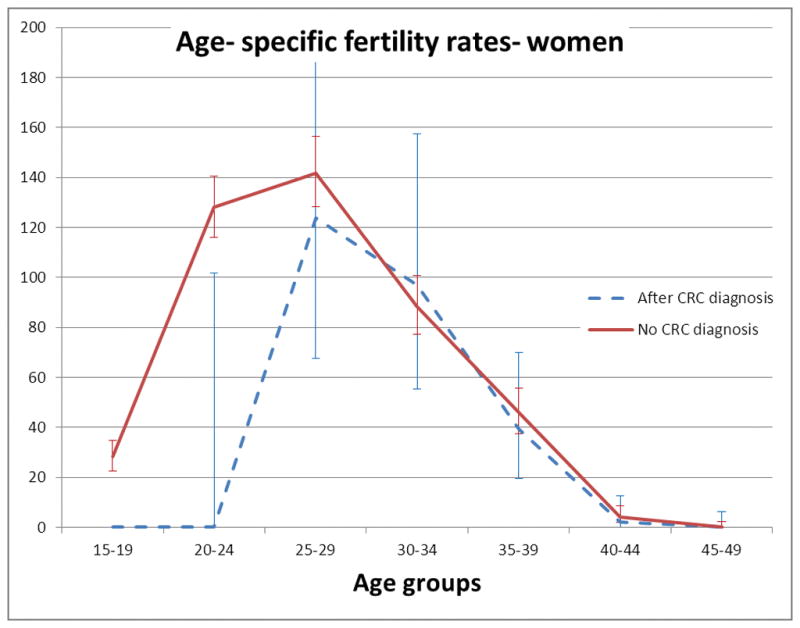
Age- specific fertility rates are given as births/ 1000 person- years. Error bars are 95% C.I. The upper C.I. for subjects with CRC in age group 25–29 has been truncated.