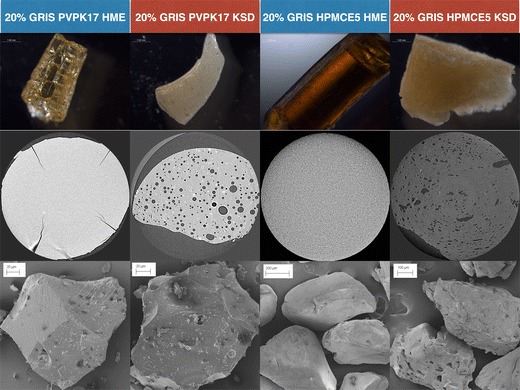
Fig. 1.

Stereo microscopy (top row), X-ray computed tomography (middle row), and scanning electron microscopy (bottom row) images of amorphous solid dispersions containing 20% GRIS in PVP K17, HME processed (column 1) and KSD processed (column 2), and HPMC E5, HME processed (column 3) and KSD processed (column 4)
