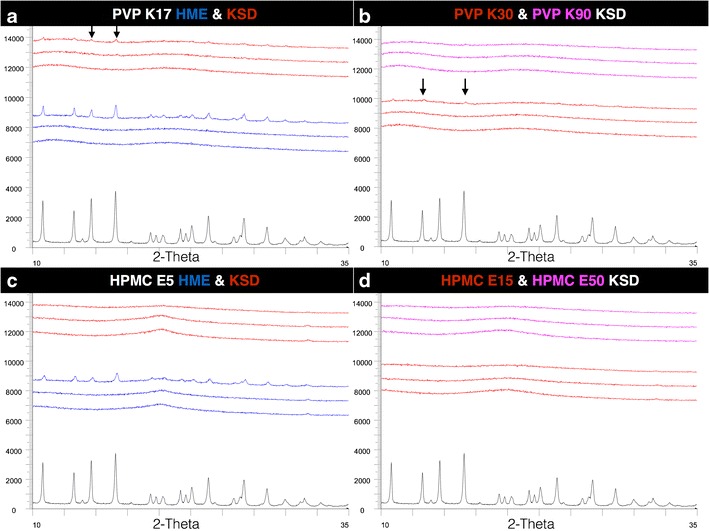
Fig. 6.

PXRD profiles from samples stored at 40°C/43%RH for 6 months (from bottom to top) of GRIS crystalline drug ( ), HME processed dispersions (
 ), and KSD processed dispersions (
 ) (from 10% to 40% drug load) in a (PVP K17) and c (HPMC E5). KSD processed dispersions of PVPK30 (
 ) and PVP K90 (
 ) (from 10% to 40% drug load) in b, and KSD processed dispersions of HPMC E15 (
 ) and HMPC E50 (
 ) (from 10% to 40% drug load) in d. Areas of observed trace crystallinity are marked with arrows
