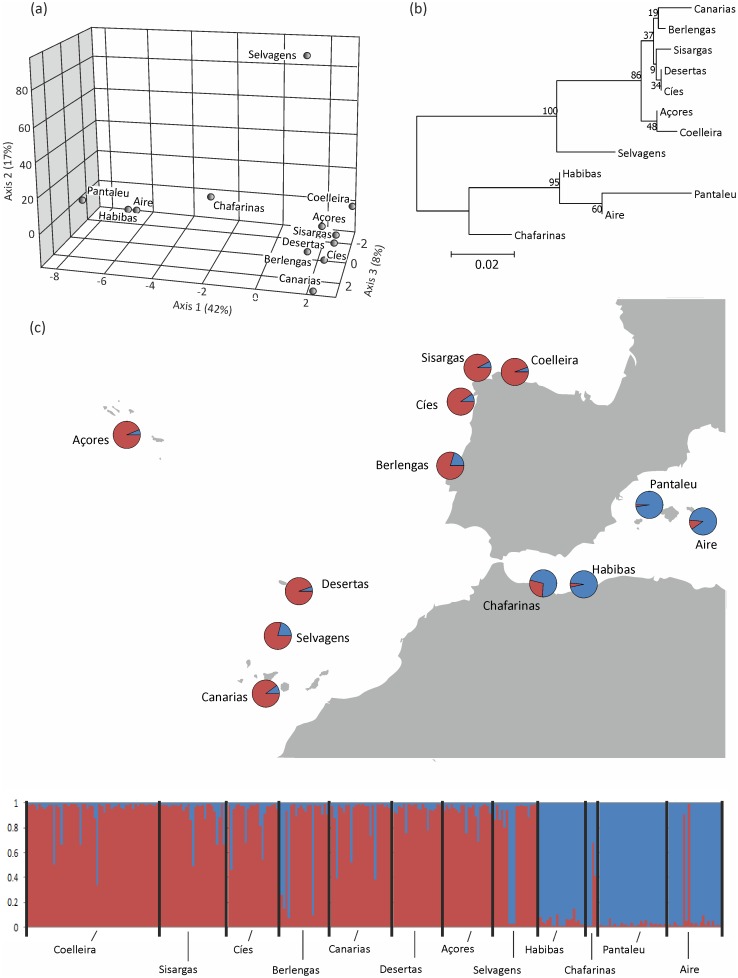
Fig 4. Population genetic structure of Cory’s shearwater.
(a) Factorial correspondence analysis performed on pairwise allele frequency differences using GENETIX v.4. (b) Population-level neighbour-joining tree based on FST across the 10 loci with per cent bootstrap support (10,000 replicates) shown at nodes. (c) Inferred ancestry (Q-matrix) of the two genetic clusters (red: Atlantic cluster; blue: Mediterranean cluster) for populations (upper panel) and individuals (lower panel) estimated by permutation from ten Structure analyses for individuals and populations, respectively, using Clumpp.

