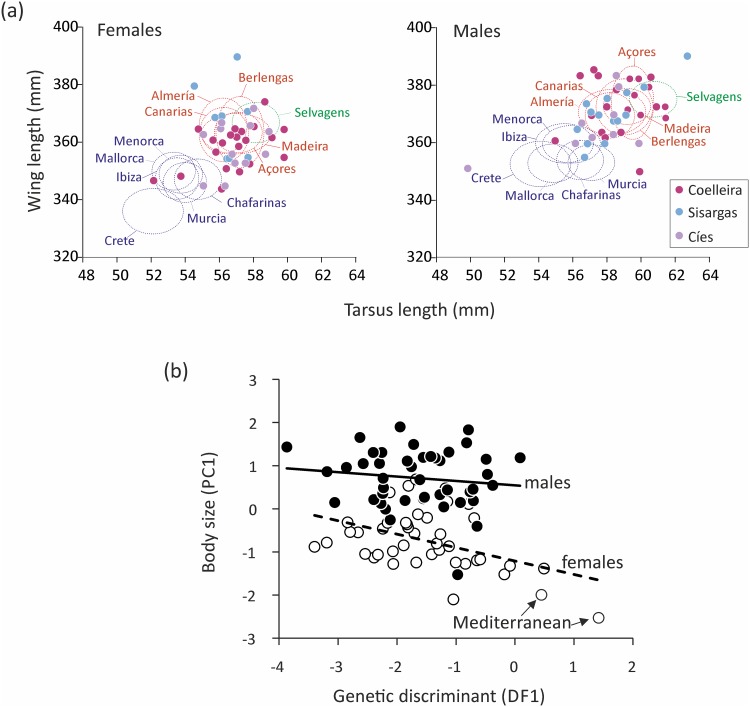
Fig 6. Morphometric comparison of Galician Cory´s shearwaters with those from populations elsewhere.
(a) Bivariate plot of wing length against tarsus length comparing the measurements of Cory’s shearwaters sampled in Galicia (Cíes, Sisargas and Coelleira) with the average values of Atlantic (red ovals) and Mediterranean (blue ovals) populations. Ovals are centered on the mean and the length of their axes is equal to one standard deviation. (b) Relationship between body size estimated as the first principal component (PC1) of a PCA analysis and the loadings in the first discriminant function (DF1) of the DAPC performed on microsatellite data (see Fig 5). Arrows indicate the two females assigned to the Mediterranean genetic cluster by the DAPC.

