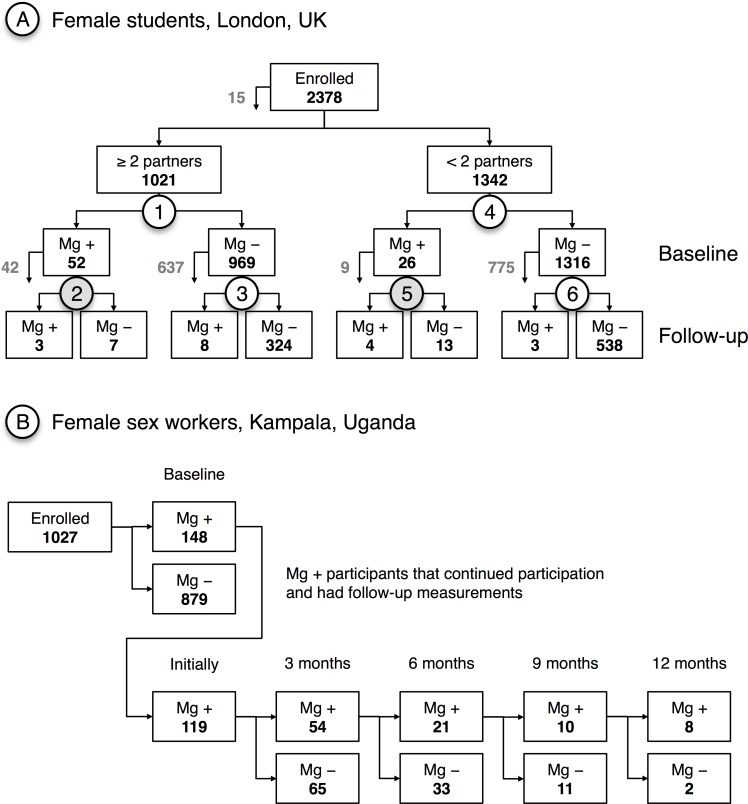
Fig 1. Flow charts of two cohort studies.
(A) Oakeshott et al. [20]; numbers 1 to 6 are data items that are referred-to in the text; follow-up was after 12–21 months (median 16 months) for items 2 and 5 (grey), and after 11–32 months (median 16 months) for items 3 and 6; arrows exiting boxes indicate numbers of participants lost. (B) Vandepitte et al. [21]; numbers of M. genitalium-positive and -negative participants at baseline, as well as numbers of participants consistently M. genitalium-positive at consecutive time points, and numbers testing negative at each time point, who were not considered further in the analysis.

