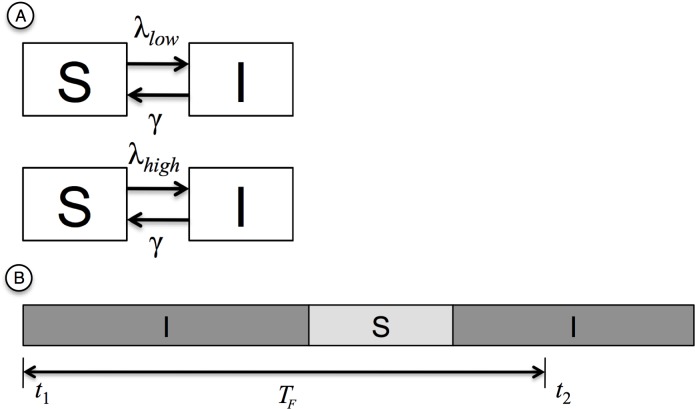
Fig 2. Schemata of model components.
(A) Schema of London-student model. S: Susceptible state; I: Infected state; λlow: incidence rate of low-risk group; λhigh: incidence rate of high-risk group; γ: recovery rate. (B) Schema of the succession of Infected and Susceptible states. S: Susceptible state; I: Infected state; t1: time at baseline; t2: time at follow-up; TF: time to follow-up; in this example, the individual was Infected at baseline and, again, at follow-up.

