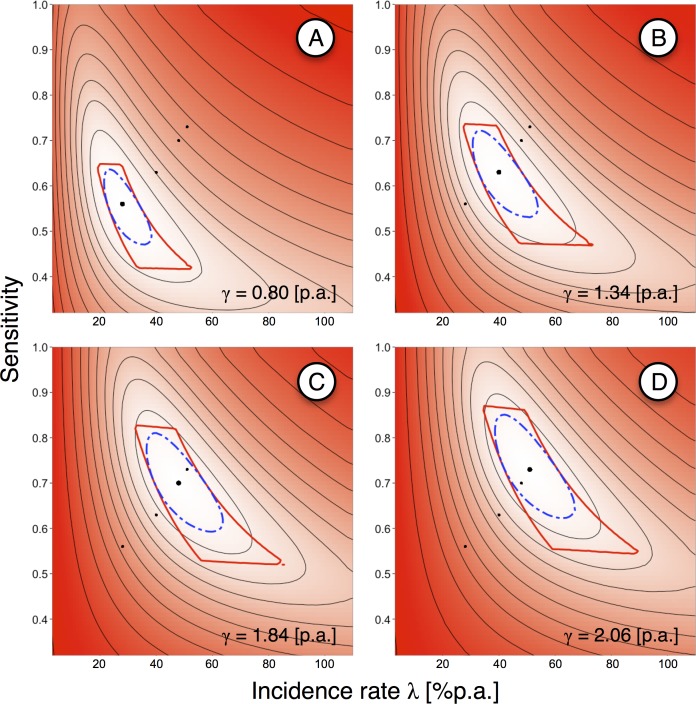
Fig 8. Incidence rate vs. sensitivity, maximum-likelihood estimates and plausible parameter ranges for different recovery rates, Ugandan sex workers.
Recovery rates, γ, all from London-student data. (A) maximum-likelihood estimate, γ = 0.80p.a. (B) upper bound of 95% confidence interval, γUCL = γstable = 1.34p.a. (C) highest possible estimate, γmax = 1.84p.a. (D) highest possible estimate when assumed stable partnerships were excluded, γstable,max = 2.06p.a. Thick, black dots: MLEs for incidence rate and sensitivity with fixed recovery rates; thin, black dots: maximum-likelihood estimates (MLEs) for the other recovery rates; thin, black contours: equal likelihood; colored areas: white indicates maximum likelihood, red indicated low likelihood; thick, dashed, blue contour: 95% CI of the MLE; thick, red contour: parameter areas where the model is consistent with the empirical data (α<0.05).

