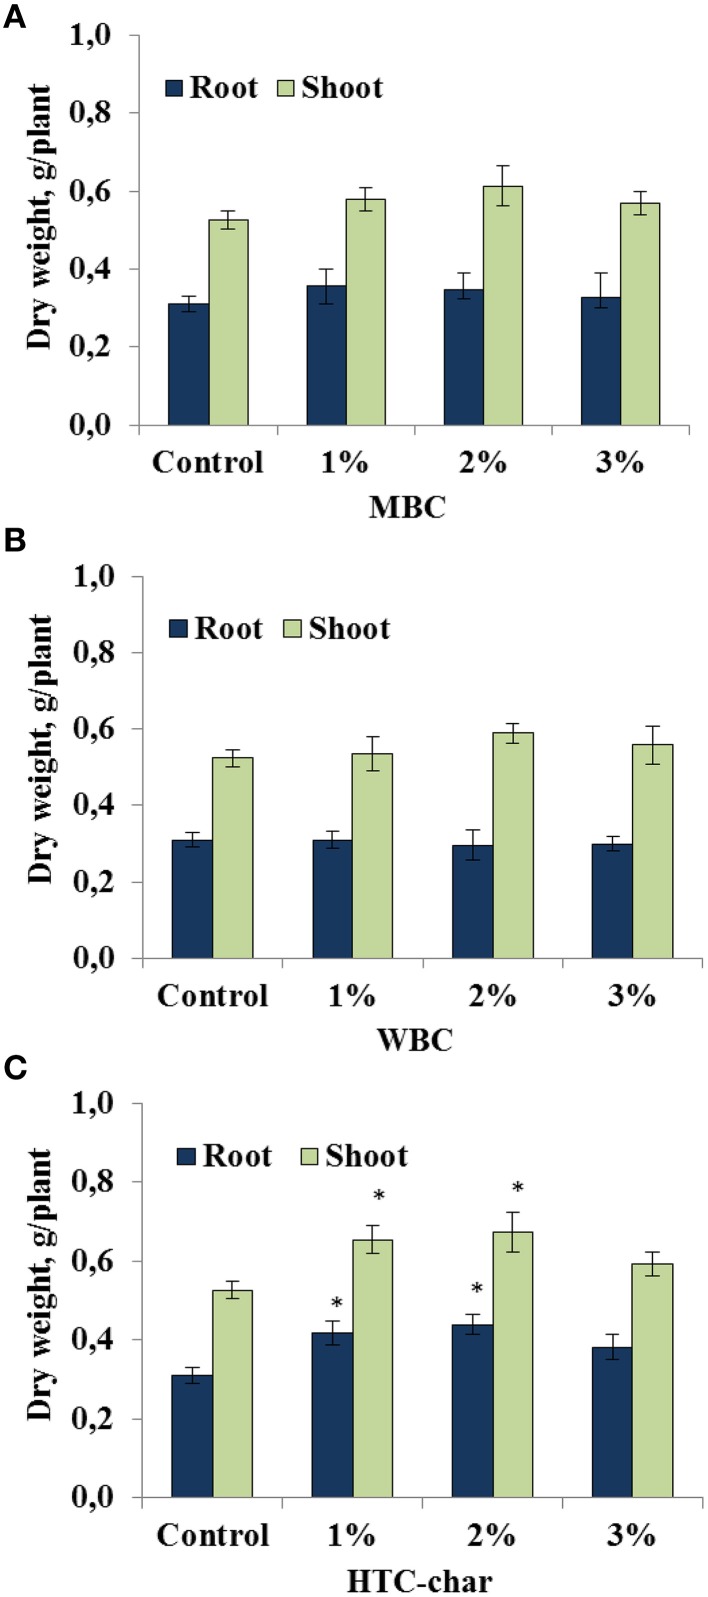
Figure 1.
Root and shoot dry weights of soybeans grown in a greenhouse for 30 days under three maize biochar (MBC) (A), wood biochar (WBC) (B), and HTC-char (C) concentrations (1, 2, and 3%). Columns represent means for six plants (N = 6) with error bars showing the standard deviation. Columns marked with an asterisk differed significantly from uninoculated plants at P < 0.05.

