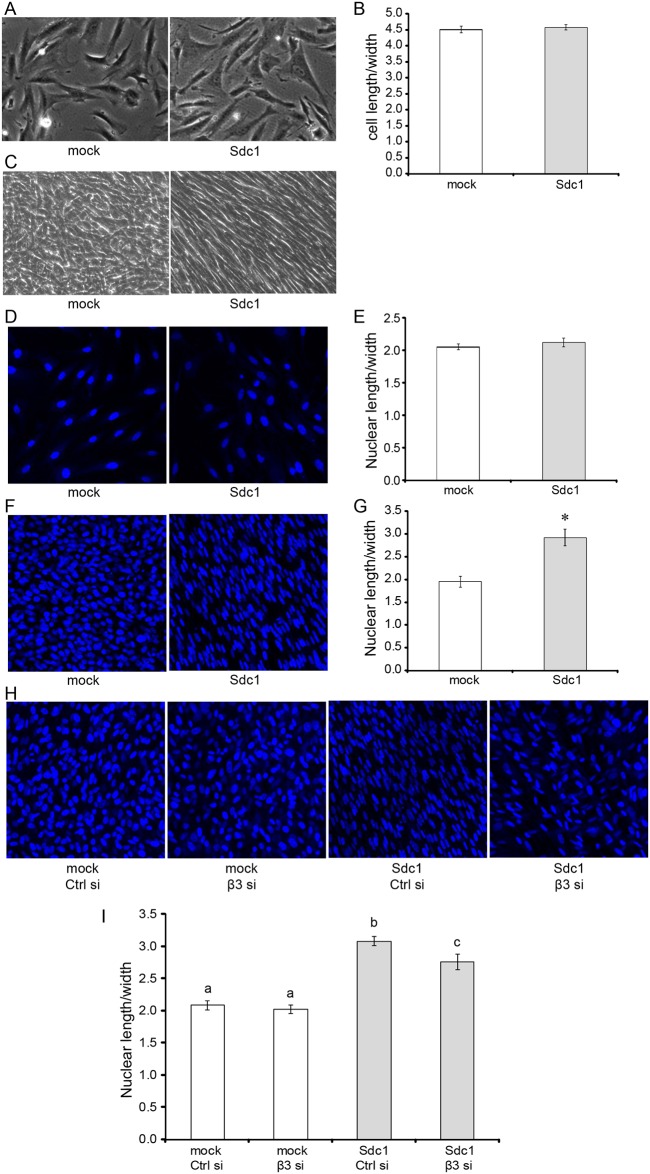
Fig 8. Integrin αvβ3 activity is involved in Sdc1-induced morphological changes during 3D ECM production.
A-B, representative phase contrast images of HMF mock and Sdc1 cells cultured on gelatin-coated plates under semiconfluent states (A; original magnification: 100x) and the corresponding mean elongation indices (ratio of cell length/width) of HMF mock and Sdc1 cells (B). C, representative phase contrast images of HMF mock and Sdc1 cells after 7 d of culture under conditions permissive for 3D ECM production (Original magnification: 100x). D-E, representative confocal images of the nuclei of HMF mock and Sdc1 cells cultured on gelatin-coated plates under semiconfluent states (D; original magnification: 200x) and the corresponding mean nuclear elongation indices (ratio of nuclear length/width) of HMF mock and Sdc1 cells (E). The nuclei were labeled with Hoechst 33342. F-G, representative confocal images of the nuclei of HMF mock and Sdc1 cells after 7 d of culture under conditions permissive for 3D ECM production (F; Original magnification: 200x) and the corresponding mean nuclear elongation indices of HMF mock and Sdc1 cells (G). The nuclei were labeled with Hoechst 33342. *indicates that the difference was statistically significant (p<0.0001). H-I, representative confocal images of the nuclei of control siRNA or β3 siRNA treated HMF mock and Sdc1 cells after 7 d of culture under conditions permissive for 3D ECM production (H; original magnification: 200x) and the corresponding mean nuclear elongation indices (I). SiRNA treatment was performed as described in Material and Methods. The nuclei were labeled with Hoechst 33342. Letters above the columns indicate the results of statistical comparisons by ANOVA. Columns sharing the same letter are not significantly different; columns labeled with different letters are significantly different (at least p<0.05).

