Figure 5.
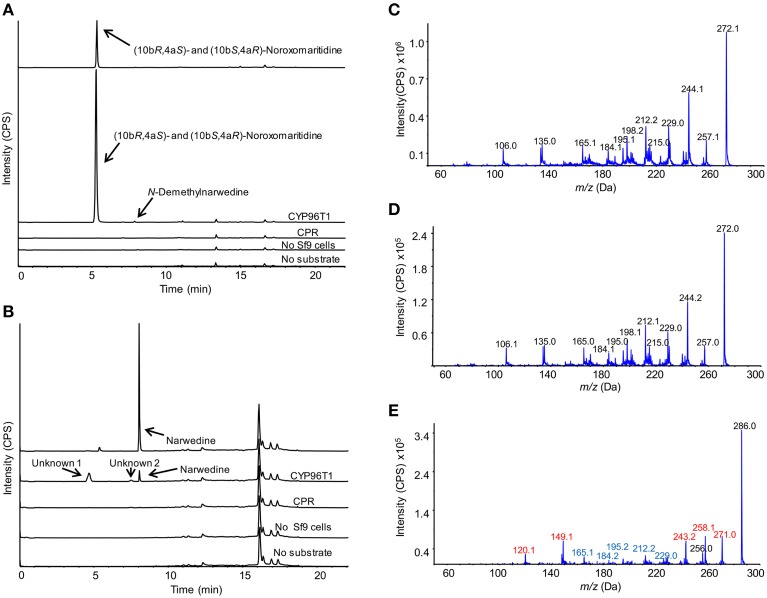
LC-MS/MS enhanced product ion scan (EPI) monitoring the C-C phenol coupling of 4′-O-methylnorbelladine and 4′-O-methyl-N-methylnorbelladine in CYP96T1 assays. Arrows indicate peaks unique to Sf9 cell containing assays with substrate present. (A) Standards and assays with 4′-O-methylnorbelladine as the substrate. Sample runs top to bottom (10bR,4aS)- and (10bS,4aR)-noroxomaritidine standard (1 μM), CYP96T1 assay, CPR assay, assay without Sf9 cells, and CYP96T1 assay without 4′-O-methylnorbelladine. (B) Standards and assays with 4′-O-methyl-N-methylnorbelladine as the substrate. Top to bottom narwedine standard, CYP96T1 assay, CPR assay, assay without Sf9 cells, and assay without 4′-O-methylnorbelladine. (C) EPI of the (10bR,4aS)- and (10bS,4aR)-noroxomaritidine standard. (D) EPI of the CYP96T1 (10bR,4aS)- and (10bS,4aR)-noroxomaritidine product with 4′-O-methylnorbelladine as substrate. (E) EPI of the CYP96T1 para-para' product (Unknown 1) with 4′-O-methyl-N-methylnorbelladine as substrate. Red fragments indicate the addition of one methyl group, 14 m/z, relative to (10bR,4aS)- and (10bS,4aR)-noroxomaritidine and blue fragments indicate the same m/z as (10bR,4aS)- and (10bS,4aR)-noroxomaritidine fragments. Intensity is presented in counts per second (CPS).

