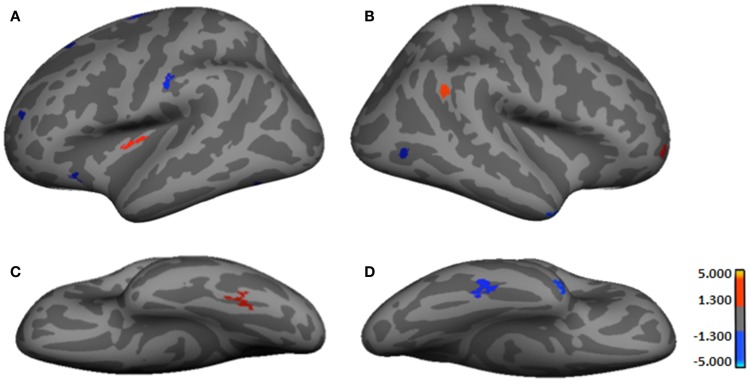
Figure 1.
Regions showing significant cortical thickness differences between groups. (A) Left lateral-view spatial map showing regions of significant thinning (red) and thickening (blue) in HYPO. (B) Right lateral-view spatial map showing regions of significant thinning (red) and thickening (blue) in HYPO. (C) Left inferior-view spatial map showing regions of significant thinning (red) in HYPO. (D) Right inferior-view spatial map showing regions of significant thickening (blue) in HYPO. As per heat bars, regions depicted in red signify thinning in HYPO (Control > HYPO) and regions shown in blue signify thickening in HYPO (Control < HYPO).

