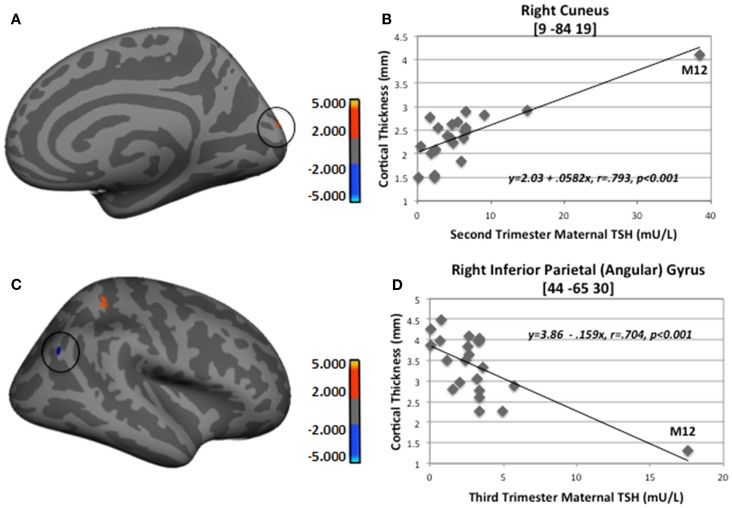
Figure 3.
Sample regions showing significant correlations between CT and second- and third-trimester maternal TSH. (A) Right medial-view spatial map showing increased thickening (red) in right cuneus as maternal second-trimester TSH increased. (B) Correlation plot between individual CT values and second-trimester maternal TSH levels in right cuneus. (C) Right lateral-view spatial map showing increased thinning (blue) in right inferior parietal angular gyrus (circled) as third-trimester maternal TSH increased. (D) Correlation plot between individual CT values and third-trimester maternal TSH levels in right inferior parietal angular gyrus. Note, these analyses included M12 outlier; however, when M12 was not included in FreeSurfer analyses, thinning in right inferior parietal angular gyrus still remained (p = 0.01).

