Figure 4.
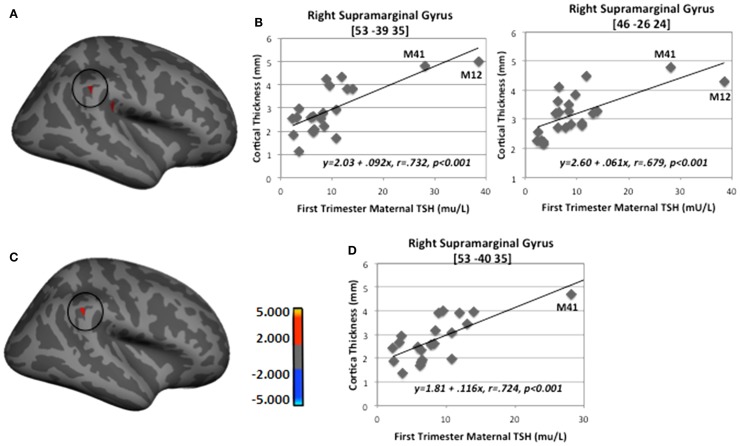
Sample regions showing significant correlations between CT and first-trimester maternal TSH. (A) Right lateral-view spatial map showing two nearby regions, indicating significant (p < 0.001) thickening (red) as first-trimester maternal TSH levels increased. (B) Correlation plots between individual CT values and first-trimester maternal TSH levels in two regions of right supramarginal gyrus. (C) Right lateral-view spatial map showing significant thickening (red) as first-trimester maternal TSH levels increased with M12 removed from FreeSurfer analysis. (D) Correlation plot between individual CT values and first-trimester maternal TSH levels in right supramarginal gyrus with M12 removed from FreeSurfer analysis. Note: correlations were retained when both outlying cases (M12 and M41) were removed from SPSS analyses shown in B (p = 0.006 and p = 0.01) and when M41 was removed from analysis shown in D (p = 0.002).

