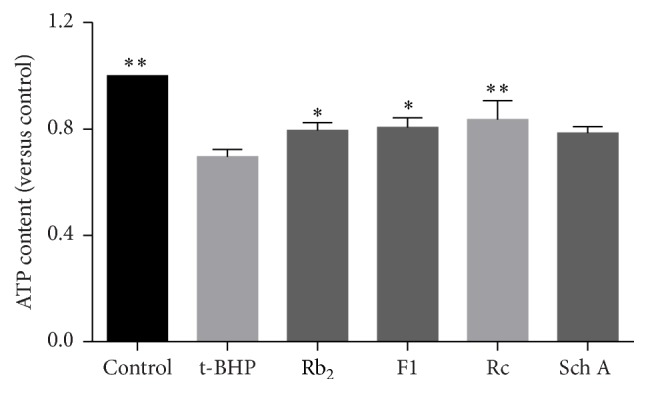
Figure 4.

Effects of SIRT1 activators on the ATP content in t-BHP treated H9c2 cells. Each bar represented the mean ± SD of triplicate experiments. Compared with t-BHP group, ∗ p < 0.05 and ∗∗ p < 0.01.

Effects of SIRT1 activators on the ATP content in t-BHP treated H9c2 cells. Each bar represented the mean ± SD of triplicate experiments. Compared with t-BHP group, ∗ p < 0.05 and ∗∗ p < 0.01.