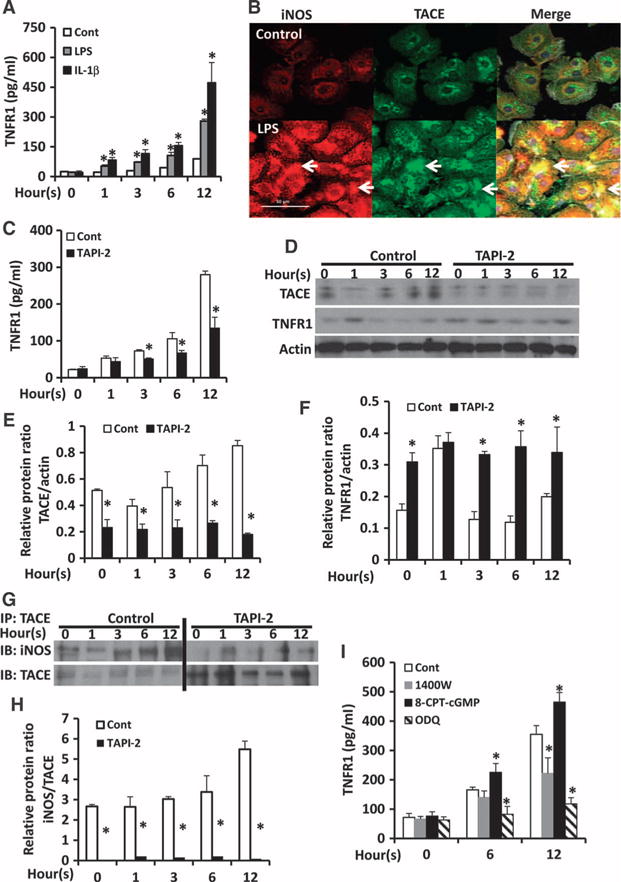
Fig. 6. TNFR1 shedding by human hepatocytes in vitro is mediated through an iNOS-cGMP-TACE pathway.

(A) Human hepatocytes were left untreated (Control) or treated with LPS (100 ng/ml) or 400 nM IL-1β for the indicated times. The concentration of TNFR1 in the culture media was determined by ELISA. Data are means ± SD from three independent experiments. *P < 0.05 by one-way ANOVA. (B) Human hepatocytes were left untreated (Control) or were treated with LPS (100 ng/ml). Cells were then analyzed by immunofluorescence microscopy to detect iNOS (red) and TACE (green). Arrows indicate the colocalization of iNOS and TACE. Scale bar, 50 mm. Images are representative of two independent experiments. (C to F) Human hepatocytes were left untreated (zero-hour time point) or were treated with LPS (100 ng/ml) in the absence (Cont) or presence of 400 nM TAPI-2 for the indicated times. (C) The concentration of TNFR1 in the culture media was determined by ELISA. Data are means ± SD from three independent experiments. *P < 0.05 by one-way ANOVA. (D) The hepatocytes were analyzed by Western blotting with antibodies specific for TACE and TNFR1. Densitometric analysis was performed to determine the relative abundances of (E) TACE and (F) TNFR1 proteins normalized to the abundance of actin. Data are means ± SD from three independent experiments. *P < 0.05 by two-tailed unpaired t test. (G and H) Human hepatocytes were left untreated (zero-hour time point) or were treated with LPS (100 mg/ml) in the absence (Cont) or presence of 400 nM TAPI-2 for the indicated times. (G) Samples were then subjected to immunoprecipitation (IP) with an anti-TACE antibody and were analyzed by Western blotting (IB) with antibodies specific for TACE and iNOS. Bands corresponding to iNOS in the TAPI-2–treated samples were only detectable when Western blots were separately developed with SuperSignal West Pico Chemiluminescent Substrate (Thermo Scientific). (H) Densitometric analysis was performed to determine the relative abundance of iNOS protein normalized to that of TACE. Data are means ± SD from three independent experiments. *P < 0.05 by two-tailed unpaired t test. (I) Human hepatocytes were treated with vehicle (0.01% DMSO), 20 μM 1400W, 100 μM 8-CPT-cGMP, or 20 μM ODQ, and then were stimulated with LPS (100 ng/ml) for the indicated times. The concentration of TNFR1 in the culture media was determined by ELISA. Data are means ± SD from three experiments. *P < 0.05 by one-way ANOVA.
