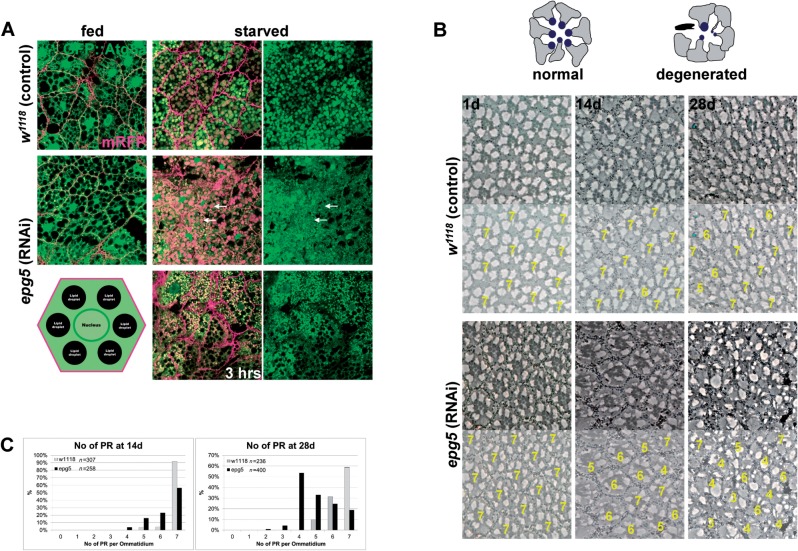
Figure 6.
Knock-down of epg5 in Drosophila. (A) Single confocal sections of fat bodies from fed and starved (6 h, unless otherwise indicated) larvae, either control or bearing RNAi-mediated downregulation of epg5. Red is membrane-bound RFP to highlight the cell membranes, green is the autophagy marker GFP::Atg8a. Arrows point to large autolysosomes from which GFP::Atg8a fluorescence is quenched on the inside, but is retained outside. Bottom left is a schematic drawing of an undigested fat body cell. (B) Semi-thin tangential eye sections from either control flies or flies bearing RNAi-mediated downregulation of epg5 and aged 1, 14, and 28 days at 29°C to induce epg5 downregulation. The drawing on top schematizes the process of cell degeneration and loss in this tissue. Below each section is an exemplary quantification of the photoreceptors in the ommatidia shown. (C) Graphs displaying the quantification of the number of photoreceptors (PR) in the ommatidia of the flies aged 14 and 28 days. Knock-down of epg5 reduces the ommatidia with a normal number of photoreceptor neurons (7) and this phenotype increases with time (χ2 values are 166.5 and 721.6 with P < 0.0001 for 6 degrees of freedom).

