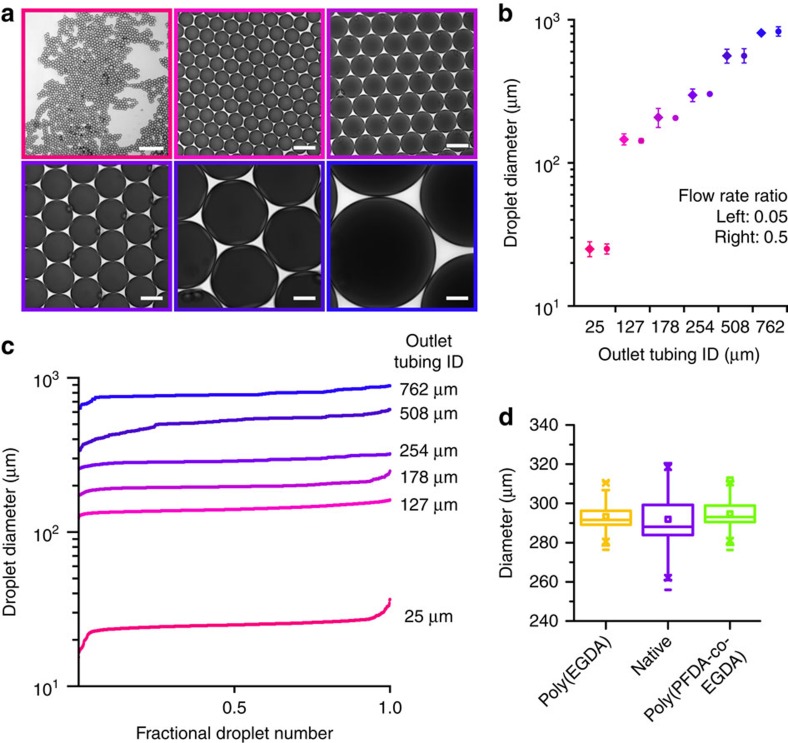
Figure 2. Images of droplets and statistics on droplet sizes using various outlet tubing sizes.
(a) Micrographs of the droplets formed using the six different sizes of outlet tubing listed. (b) Droplet diameter versus outlet tubing inner diameter for flow rate ratios of 0.05 (left, diamond) and 0.5 (right, circle). Error bars represent the s.d., some error bars are obscured by the symbols. (c) Plot of the droplet diameter versus fractional droplet number for various outlet tubing sizes. The solid lines represent the average droplet sizes for a single outlet size; each line includes values for flow rate ratios of 1:2 and 1:20 (dispersed to continuous phase). (d) Boxplot of the droplet size produced by droplet generators with the same outlet tubing (ID=254 μm) and different surface chemistries (that is, hydrophilic, native and hydrophobic) on the channels, as modified by initiated chemical vapour deposition.

