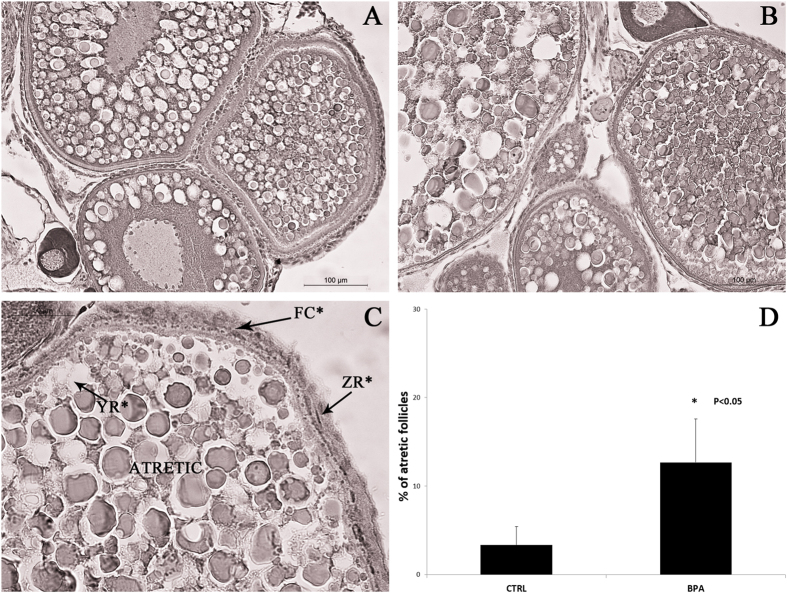
Figure 3.
Histological analysis of ovaries from control fish (A) and fish exposed (B) to 5 μg/L BPA. Ovarian sections show different follicular stages and atretic follicles. (C) A follicle with the morphological markers of atresia: ZR*: Zona radiata breakdown; YR*: Yolk resorption; FC*: Follicular cell proliferation. (D) Percentage of atretic follicles in ovary from control fish (CTRL) and fish exposed (BPA) to 5 μg/L BPA.

