Figure 2.
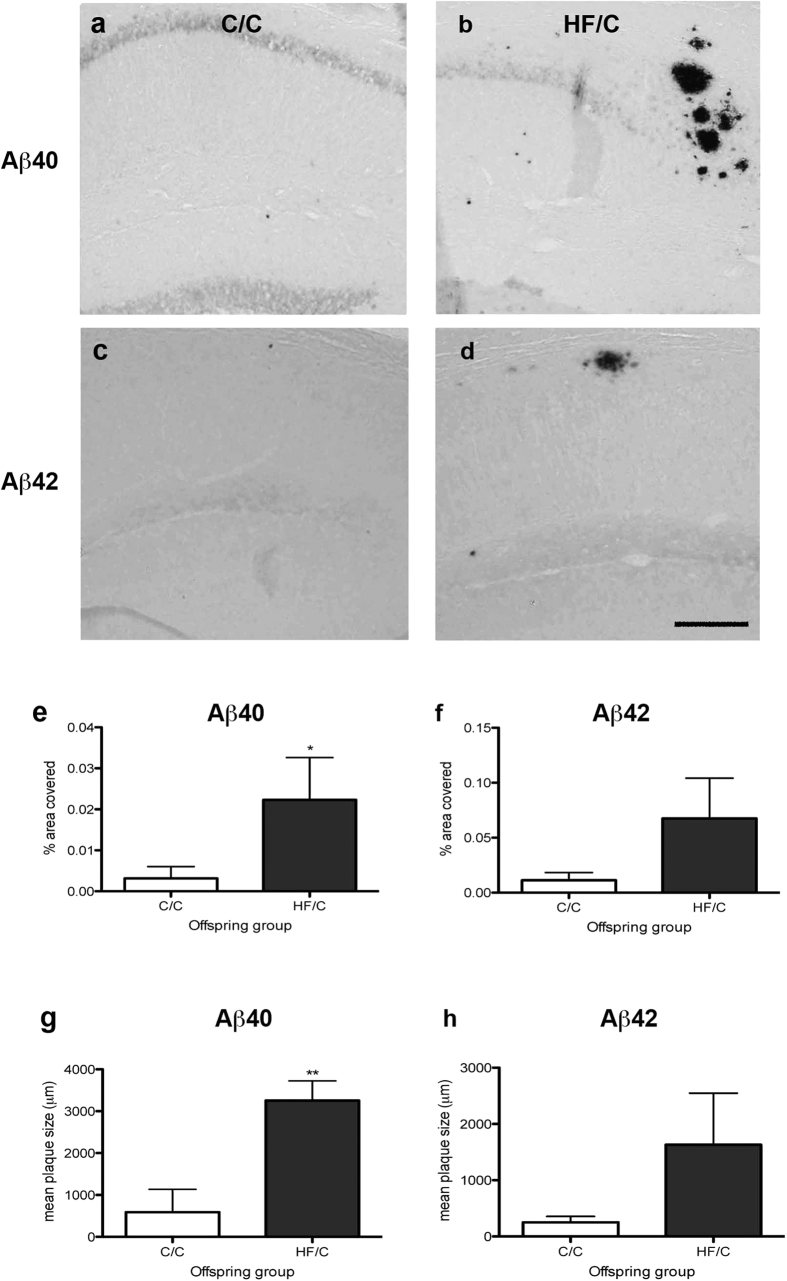
(a–d) Photomicrographs of staining of Aβ40- (a,b) and Aβ42-positive plaques (c,d) in the hippocampus of C/C (a,c) and HF/C (b,d) 11-month old Tg2576 mice. (e–h) Both percentage area and average size of Aβ40-positive plaques was significantly higher in HF/C mice compared to C/C offspring (e, g) with a similar non-significant trend observed for Aβ42 (f,h). Scale bar = 500 μm. *p < 0.05.

