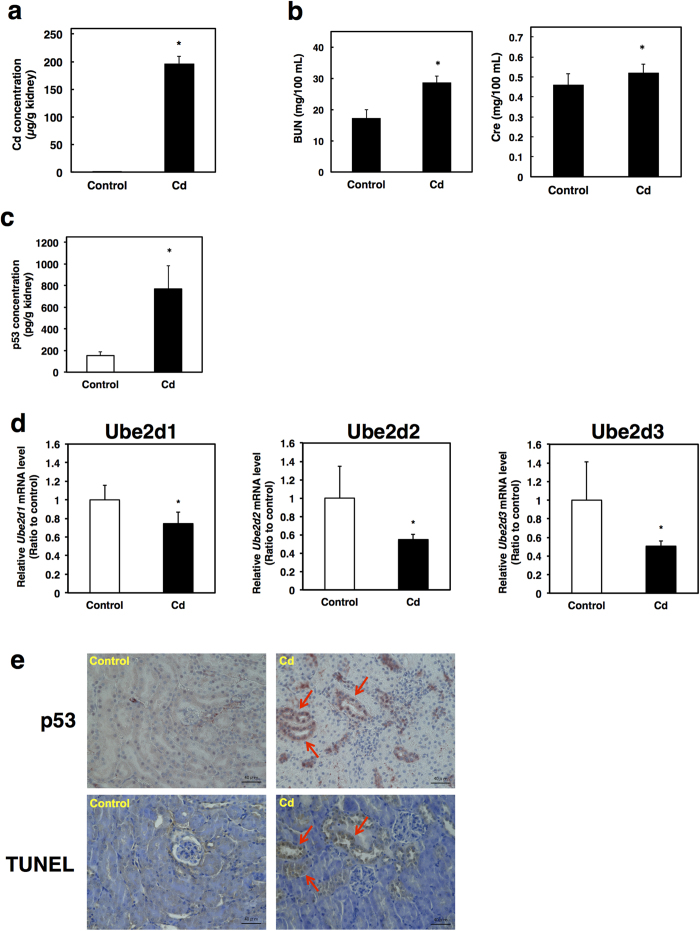
Figure 8. Cd induces both p53 accumulation and apoptosis in renal proximal tubular cells in vivo.
(a) Cd accumulation in the kidneys of mice exposed to Cd for 6 months. A portion of the kidney was obtained after 6-month Cd exposure. The kidney was digested with nitric acid hydrogen peroxide and the Cd content was measured by inductively coupled plasma mass spectrometry (ICP-MS). Cd content was normalized to the total amount of protein. (b) Changes in parameters of renal toxicity. Blood urea nitrogen (BUN) and creatinine levels (Cre) in serum were measured using the automatic dry-chemistry analyzer system. (c) Protein levels of p53 in the kidney mice exposed to Cd for 6 months. Protein levels of p53 were determined using the ELISA assay. (d) UBE2D family gene expression in the kidneys of mice exposed to Cd for 6 months. mRNA levels were measured by real time RT-PCR and normalized to ß-actin. (a–d) Values are the mean ± S.D. (n = 5 or 6). *Significantly different from the corresponding control group, P < 0.05. (e) Representative images of p53 staining and TUNEL staining. Immunohistochemical detection of p53 was performed using the anti-p53 antibody (upper panels) and detection of apoptosis was conducted by colorimetric detection of TUNEL-positive signals (lower panels). Serial sections of the mouse kidney were obtained from mice exposed to Cd for 6 months. Serial sections of kidney tissue from control mice are shown in the left panel and those of Cd-exposed mice in the right panel. Red arrows indicate p53 expression (upper panel) and apoptotic cells (lower panel). Original magnification: × 400.

