-
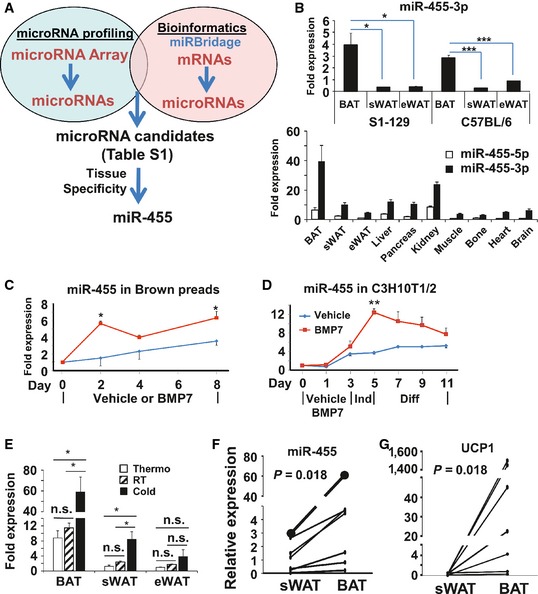
A
microRNA and mRNA arrays were performed on C3H10T1/2 cells treated with vehicle or BMP7. The gene sets from the mRNA arrays were subjected to mirBridge analysis to predict the microRNAs. microRNA candidates were selected as those with up‐ or down‐regulation by > 1.5‐fold in microRNA arrays and
P < 0.05 in mirBridge analysis (
Appendix Table S1).
-
B
miR‐455 expression in different tissues of C57BL/6 and S1‐129 mice at the age of 5 weeks (n = 5–6).
-
C, D
miR‐455 expression during the differentiation of brown preadipocytes (C) and C3H10T1/2 cells (D). Shown is a representative of four independent experiments for each cell type.
-
E
C57B/L6 mice were maintained at thermoneutral temperature, room temperature (RT), or 5°C (cold) for 7 days, and miR‐455 expression was quantified by qRT–PCR (n = 6).
-
F, G
Expression of miR‐455 (F) and UCP1 (G) in human BAT versus sWAT from 7 individuals (
Appendix Table S2) quantified by qRT–PCR was expressed in arbitrary units.
Data information: Data were analyzed with Student's
t‐test (B–E) or the Wilcoxon matched‐pairs signed‐ranks test (F, G) and are presented as mean ± SEM (*
P < 0.05, **
P < 0.01, and ***
P < 0.001; n.s., non‐significant).