-
A–C
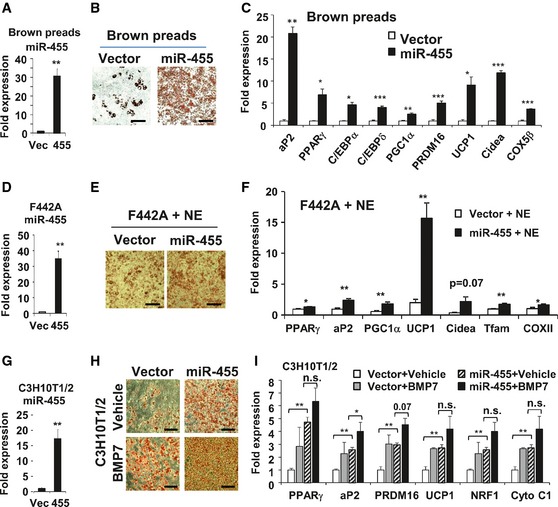
miR‐455 expression (A), Oil Red O staining (B), and qRT–PCR analysis of gene expression quantified (C) in brown adipocytes (day 17).
-
D–F
miR‐455 expression (D), Oil Red O staining (E), and qRT–PCR analysis of gene expression (F) in 3T3‐F442A adipocytes (day 8) incubated with 100 μM norepinephrine (NE) for 4 h.
-
G–I
miR‐455 expression (G), Oil Red O staining (H), and qRT–PCR of gene expression (I) in C3H10T1/2 adipocytes (day 8).
Data information: All of the cells were transduced by empty or miR‐455 lentiviral vectors. Stably transduced cells were selected, pooled, and differentiated (see
Materials and Methods). Data were analyzed with Student's
t‐test and are presented as mean ± SEM of a representative of 3 independent experiments each performed in triplicates (*
P < 0.05, **
P < 0.01, and ***
P < 0.001; n.s., non‐significant). Scale bar, 50 μm.

