-
A, B
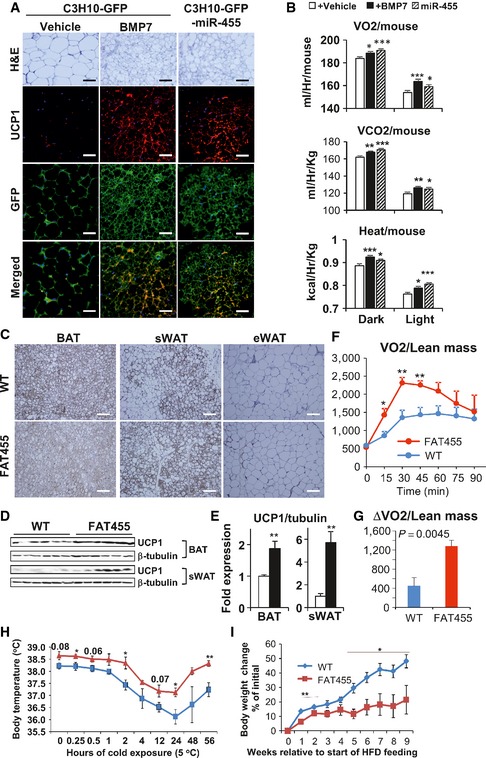
C3H10T1/2‐GFP and ‐lentimiR‐455 cells were injected into the thoracic area of male nude mice subcutaneously (n = 6/group). Five weeks after injection, the implanted cells were dissected for histology and analyzed by H&E staining and immunostaining (scale bar, 25 μm) (A); CLAMS analysis of nude mice receiving implant (B).
-
C–E
UCP1 expression of FAT455 mice subjected to a 10‐day cold challenge (5°C) (n = 7/group). (C) UCP1 immunohistochemistry of adipose tissues (scale bar, 50 μm). Western blots (D) and the respective densitometry quantification normalized to tubulin (E).
-
F
Time course of NE‐induced oxygen consumption in mice maintained at 5°C for 8 days (n = 6/group).
-
G
Maximal NE‐induced thermogenic capacity expressed as ΔVO
2 (maximal VO
2 − basal VO
2).
-
H
Mice were initially maintained at room temperature and then transferred to cold incubator (5°C). Rectal body temperature was recorded at the indicated time points using thermoprobe.
-
I
WT and FAT455 mice with similar initial body weight were fed with high‐fat diet (HFD) and placed under the condition of single cage pair feeding, where FAT455 mice were fed the same amount of food as WT littermates. Body weights were recorded over time.
Data information: Data were analyzed with Student's
t‐test and are presented as mean ± SEM (B, E, F, G, H, I) (*
P < 0.05, **
P < 0.01, and ***
P < 0.001).

