-
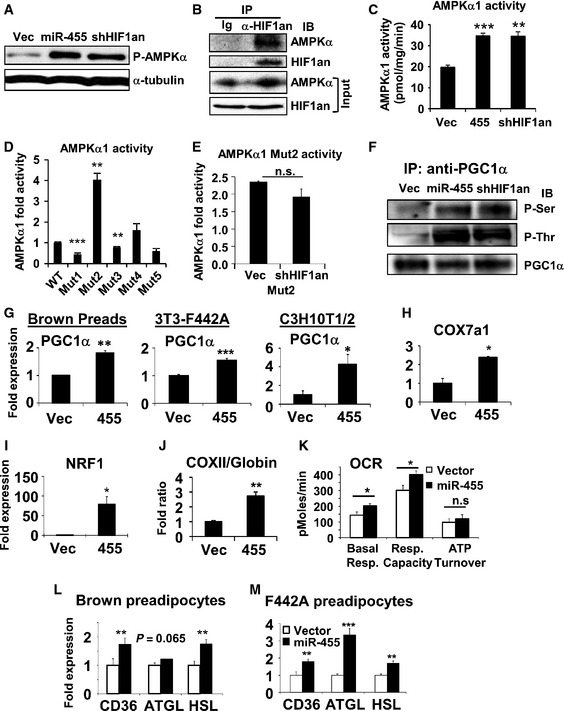
A–F
Experiments performed in brown preadipocytes transduced with the indicated lenti‐ or retroviruses. (A) Western blot analysis of AMPKα1(Thr172)‐phosphorylation. (B) Immunoprecipitation (IP) with control normal immunoglobulin (Ig) or anti‐HIF1an antibody, and probed with anti‐HIF1an and anti‐AMPKα antibodies. 10% of cell lysates loaded as input. (C) IP with anti‐AMPKα1 antibody first and then quantified for AMPKα1 activity. (D) IP with anti‐Flag agarose beads from Flag‐AMPKα1 WT or Asn>Ala mutants‐expressing brown preadipocytes, and assayed for AMPKα1 activity. (E) Flag‐AMPKα1 Mutant2‐expressing cells were transduced with empty vector or shRNA‐HIF1an lentiviruses, and then IP with anti‐Flag agarose beads. AMPK activity in precipitates was measured. (F) IP of PGC1α from cell lysates as in (A) using anti‐PGC1α antibody. Phospho‐serine and phospho‐threonine and total precipitated PGC1α were detected by Western blots.
-
G
qRT–PCR analysis of PGC1α expression in the undifferentiated cells overexpressing miR‐455.
-
H–K
Mitochondrial gene expression (H‐I), DNA ratio of mito‐gene (COXII) versus nuclear gene (β‐globin) (J), and bioenergetic analysis by Seahorse (K) in undifferentiated C3H10T1/2 cells.
-
L, M
Expression of fatty acid mobilization and lipolytic genes in brown and white preadipocytes overexpressing miR‐455 quantified by qRT–PCR.
Data information: Data were analyzed with Student's
t‐test and are presented as mean ± SEM of a representative from 3 to 5 independent experiments each performed in triplicates (C–E, G–M) (*
P < 0.05, **
P < 0.01, and ***
P < 0.001; n.s., non‐significant).

