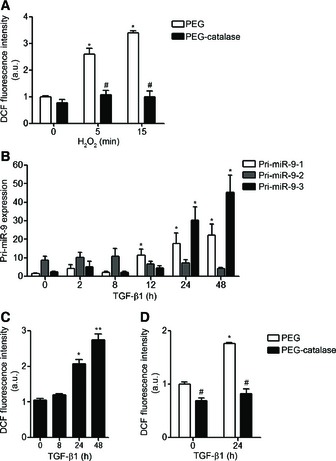
Figure EV1. Effect of PEG‐catalase on H2O2‐ and TGF‐β1‐induced ROS production and effect of TGF‐β1 on the expression of miR‐9‐5p precursors and on ROS production in HFL‐1 cells.

- Lung fibroblasts were treated with 100 μM H2O2 for the indicated times after pre‐incubation for 2 h either with polyethylene glycol (PEG) or with 100 U/ml PEG‐catalase (n = 3–5). Intracellular ROS production was measured using 2′,7′‐dichlorofluorescein diacetate (DCFH‐DA) reagent and analyzed by FACS.
- qRT–PCR analysis of miR‐9‐5p primary transcripts (pri‐miR‐9) levels in HFL‐1 cells stimulated with 5 ng/ml TGF‐β1 for the indicated times (n = 4–7).
- Intracellular ROS production in HFL‐1 cells treated with 5 ng/ml TGF‐β1 for the indicated times was measured as described in (A) (n = 3–5).
- Intracellular production of ROS in HFL‐1 cells pre‐treated as described above and treated with 5 ng/ml TGF‐β1 for 24 h was measured as described in (A) (n = 3–5).
Data information: Bar graphs show mean ± SEM; two‐tailed Mann–Whitney U‐test and Kruskal–Wallis non‐parametric ANOVA (B); *P < 0.05, **P < 0.01 compared to control cells and # P < 0.05 compared to control cells at the same time point. a.u., arbitrary units.
