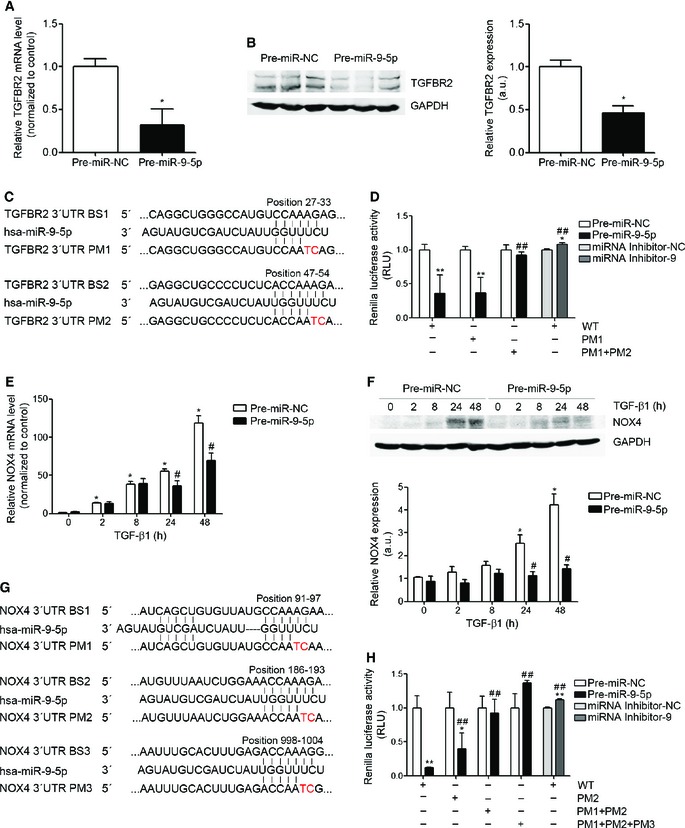
qRT–PCR analysis of TGFBR2 expression in HFL‐1 cells transfected with 40 nM pre‐miR‐NC (control) or pre‐miR‐9‐5p for 48 h (n = 5).
Western blot analysis (left) and quantification (n = 6) (right) of TGFBR2 protein levels in HFL‐1 cells transfected as indicated in (A).
Sequence of miR‐9‐5p and their base pairing (bars) with the BSs in the 3′ UTR of human TGFBR2 mRNA. PMs are symbolized by red letters.
Luciferase activity in HFL‐1 cells co‐transfected with psiCHECK2 containing WT or mutated 3′ UTR sequences of human TGFBR2 and 40 nM of pre‐miRs or miRNA inhibitors (n = 3).
qRT–PCR analysis of NOX4 expression in HFL‐1 cells transfected as described in (A) and treated with 5 ng/ml TGF‐β1 for the indicated times (n = 4).
Western blot analysis (above) and quantification (below) of NOX4 expression in HFL‐1 cells treated as described in (E) (n = 4).
Localization of the three miR‐9‐5p predicted BSs in the 3′ UTR of human NOX4 gene represented as described in (C).
Luciferase activity as described in (D) with the WT or mutated 3′ UTR sequences of human NOX4 gene (n = 3).
Data information: Data are shown as mean ± SEM; two‐tailed Mann–Whitney
U‐test; and *
P < 0.05, **
P < 0.01 compared to control cells,
#
P < 0.05 compared to its corresponding negative control condition and
##
P < 0.01 compared to WT 3′ UTR sequence and pre‐miR‐9‐5p co‐transfected cells. a.u., arbitrary units; RLU, relative light units.

