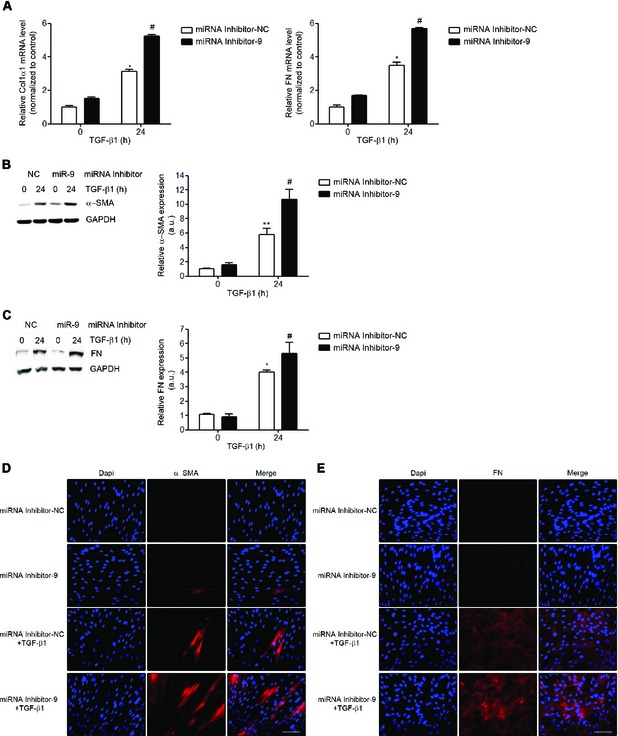
Figure EV2. Inhibition of miR‐9‐5p amplifies TGF‐β1‐induced transformation of human lung fibroblasts into myofibroblasts.

-
AqRT–PCR analysis of Col1α and FN (n = 4) expression levels in HFL‐1 cells transfected with 40 nM miRNA inhibitor NC (control) or miRNA inhibitor‐9‐5p and treated with 5 ng/ml TGF‐β1 for 24 h.
-
B, CProtein levels (left) of α‐SMA (n = 5) (B) and FN (n = 4) (C) in HFL‐1 cells described in (A). Quantification of protein expression (right). a.u., arbitrary units.
-
D, EFluorescence microscopy images of HFL‐1 cells stained with specific antibodies against α‐SMA (D, middle panels) and FN (E, middle panels) after transfection as described in (A) and TGF‐β1 treatment for 24 h (n = 3). Nuclei were stained with DAPI (blue). Scale bars: 100 μm.
Data information: All bar graphs show mean ± SEM; two‐tailed Mann–Whitney U‐test; *P < 0.05 , **P < 0.01 compared to control cells and # P < 0.05 compared to its corresponding negative control time point.
