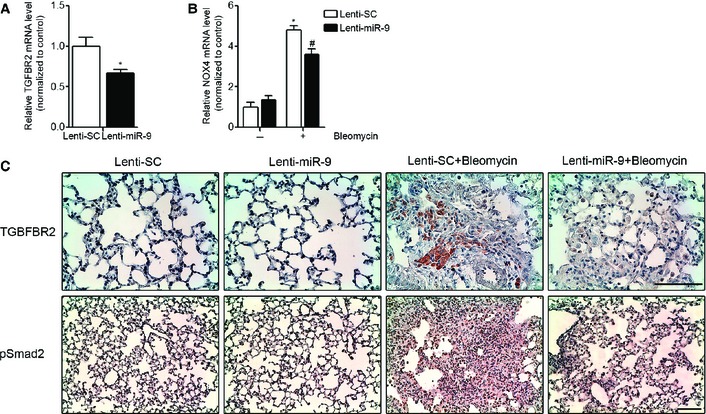
qRT–PCR analysis of TGFBR2 expression in lungs from mice administered lenti‐SC (control) or lenti‐miR‐9 (1 × 10⁶ i.f.u.) (n = 4 mice per group).
qRT–PCR analysis of NOX4 expression in lungs from mice given lenti‐SC (control) or lenti‐miR‐9 (1 × 10⁶ i.f.u. per mouse) for 4 days followed by orotracheal bleomycin administration (1.5 U/kg body weight in 40 μl saline) or saline for 14 days (n = 4 mice per group).
Microphotographs of TGFBR2 and pSmad2 expression in mouse lung samples described in (B) (n = 4 mice per group). Scale bars: 100 μm.
Data information: Bar graphs show mean ± SEM; two‐tailed Mann–Whitney
U‐test; *
P ˂ 0.05 compared to saline‐treated mice administered lenti‐SC and
#
P ˂ 0.05 compared to bleomycin‐treated mice administered lenti‐SC.

