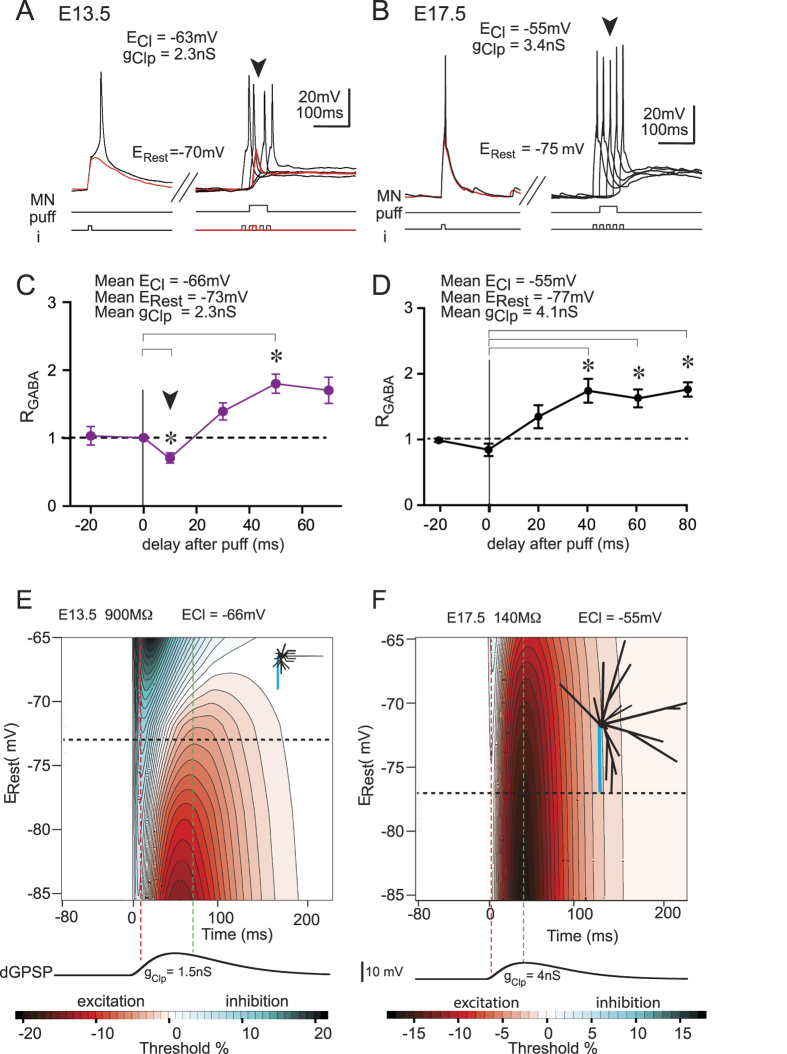
Figure 3. Time course of the excitatory and inhibitory effects of dGPSPs in E13.5 and E17.5 neurons with modified ECl values.
(A,B) Patch-clamp recordings of an E13.5 MN (A) with ECl reduced to −63 mV and an E17.5 MN (B) with ECl increased to −55 mV during the injection of a threshold current pulse (i) in the absence (left traces) and presence (right traces) of an isoguvacine-induced response (puff). The arrowhead indicates inhibition (spike failure in A and spike amplitude reduction in B) at t = 10 ms after the initiation of MN responses to the isoguvacine puff. (C,D) Average time courses of the effects that were produced by isoguvacine in the E13.5 MNs (C, n = 5) and the E17.5 MNs (D, n = 10). Panels (A,C) are also presented in Fig. 5C,E. (E,F) IETC maps obtained from simulations using the parameters of the E13.5 (E) and E17.5 (F) neuron models with ECl values of −66 mV and −55 mV, respectively. The red and green vertical dashed lines represent the maximum inhibitory and excitatory effects, respectively, that were observed at the average resting membrane potential (horizontal black dashed line).

