
Figure 4. IETC maps generated from E13.5 (A) and E17.5 (B) neuron models with similar ECl values (−69 mV).
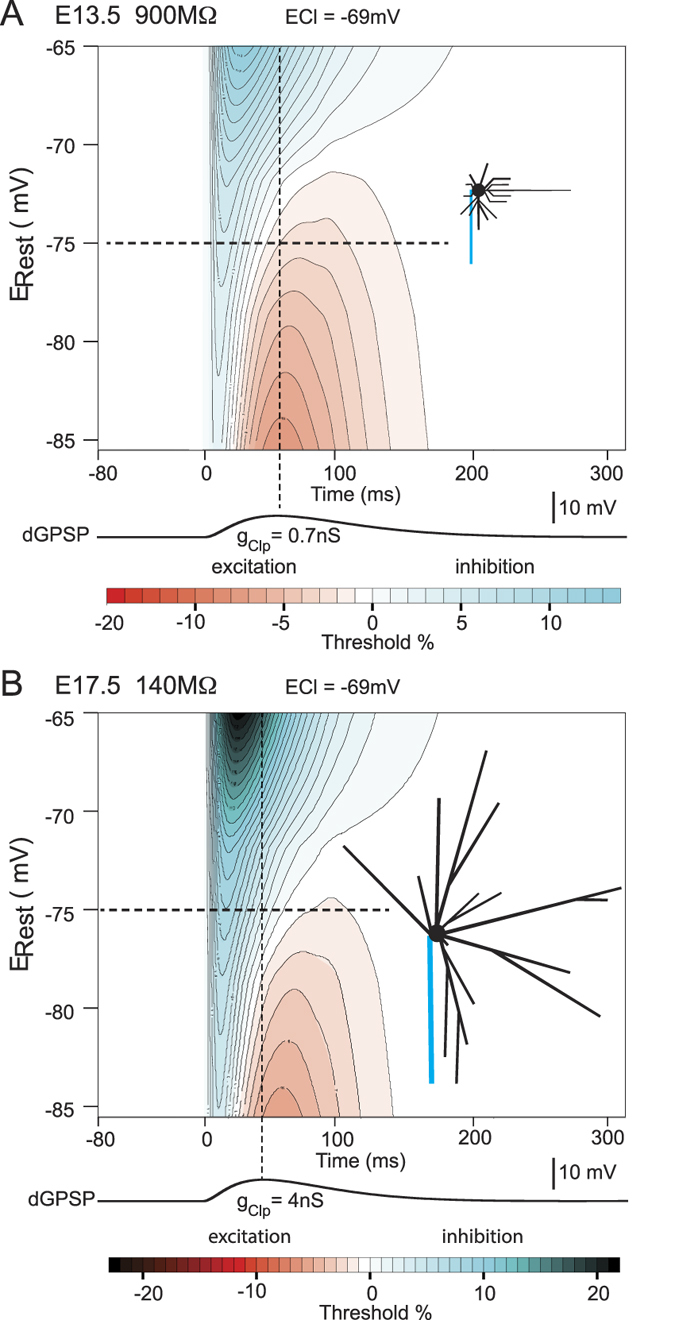
The conductance (gClp) of the simulated GABAAR synapse was adjusted to elicit the same depolarization (7 mV) in both of the neuron models. The vertical black dashed lines indicate the peak in GPSP depolarization. The horizontal black dashed lines represent the average resting potential.