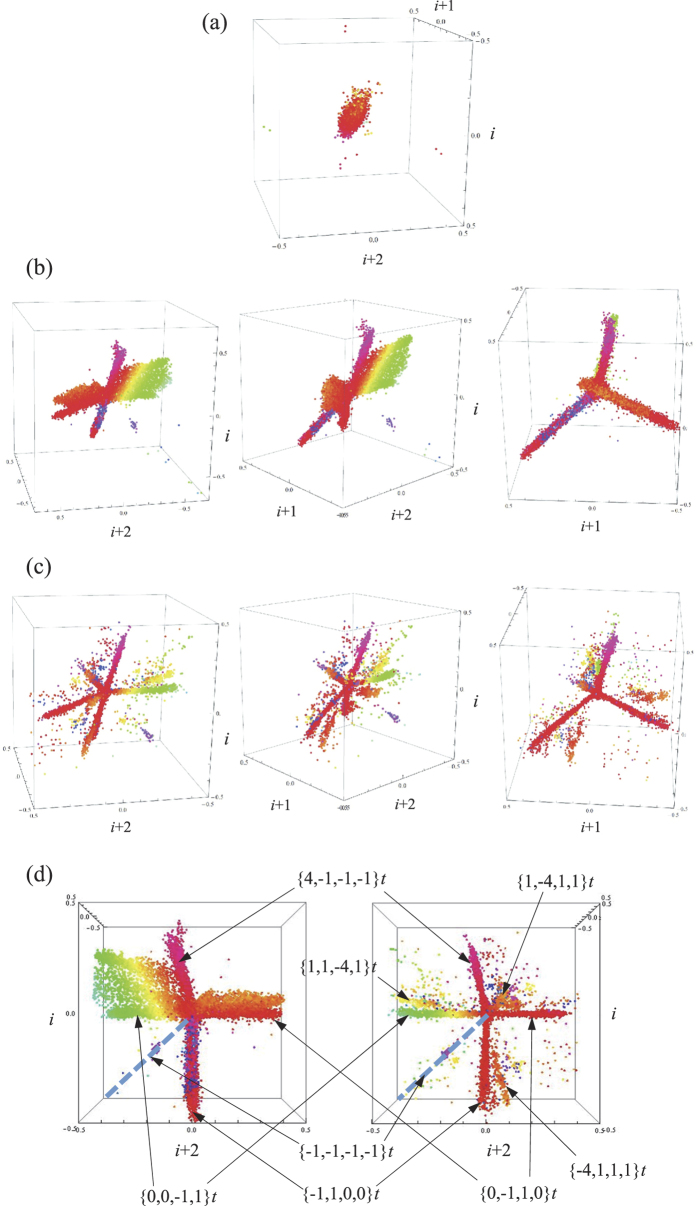
Figure 2.
(a) 4-dimensional plot of the locations of the M − 3 vectors Δi (i = 1, ..., M − 3) of a normal HR (a healthy adult). (b,c) Same for two subjects with chronic heart failure (three view angles each). The plots in (b,c) at the right show the universality of patterns when projected with the appropriate angle. (d) Identification of the main lines in heart failure in two different subjects with HF.

