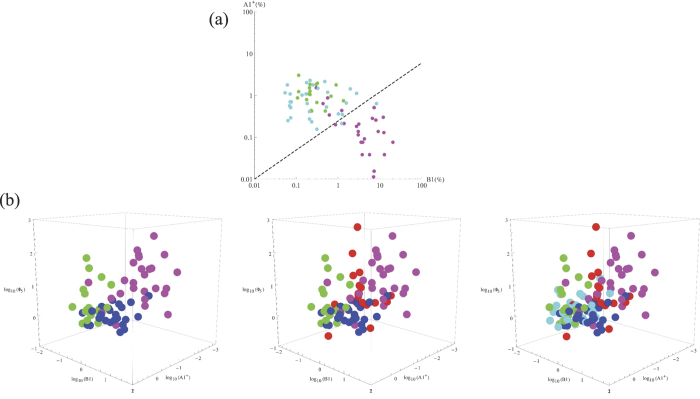
Figure 3.
(a) The different regions of normal and HF conditions found in this study: NSR (normal activity -n.a.-, green; Fantasia, cyan); HF (magenta). (b) The different regions occupied by the four conditions found in this study in the multivariate space  : NSR (n.a., green; Fantasia, cyan); MI (blue); SD (red); HF (magenta). For better clarity, left panel provides three conditions (NSR n. a., MI and HF), the central panel four (NSR n. a., MI, SD and HF), and the right panel all conditions studied. N = 5.

