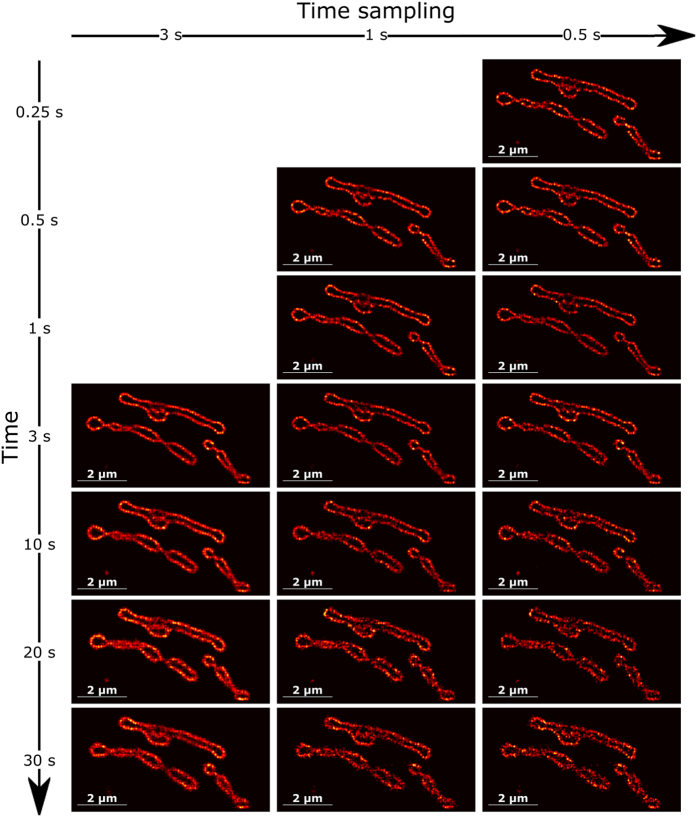
Figure 5. SPIDER reconstruction of the region indicated by the box in Fig. 4a.
The different images are reconstructed at different times and for a time sampling ranging from 3 s (averaging of SPIDER density estimations over 100 frames) down to 0.5 s (averaging of SPIDER density estimations over 15 frames). It shows that increasing time sampling for live-cell imaging super-resolution can provide enhancement of the spatial signal and allows following structural and morphological changes.

