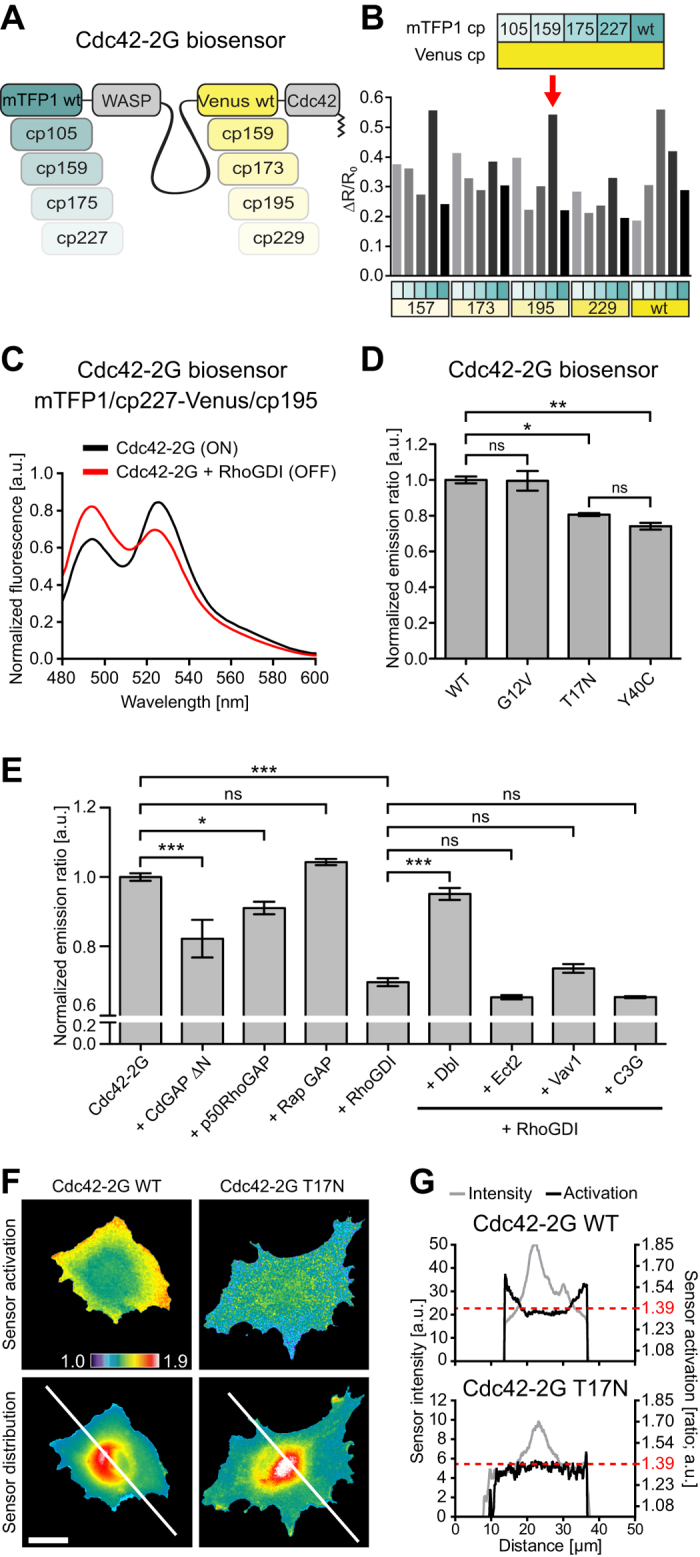
Figure 3. Construction and characterization of a genetically-encoded Cdc42 FRET biosensor.

(A) Schematics of the 25 constructs of the Cdc42-2G biosensor library. (B,C) Fluorometry-based screening of the Cdc42 biosensor library. (B) A suspension of HEK293FT cells expressing Cdc42-2G alone (ON state) was measured. ΔR/R0 values represent changes in FRET efficiency between the ON or OFF states. Key indicates the specific mTFP1 and Venus mutants screened. Arrow indicates the selected biosensor. (C) Fluorescence spectrum of the selected Cdc42-2G biosensor. Spectrum is normalized by the area under the curve. (D) Evaluation of Cdc42-2G mutants. Indicated mutants were transfected and analyzed by fluorometry. n = 2 experiments. Gaussian distribution; Bonferroni’s multiple comparison test; α = 0.05; *P < 0.05; **P < 0.001. (E) Evaluation of Cdc42-2G response to upstream regulators. Transfected HEK293FT cells were analyzed in 96-well plates by high content microscopy. Average ER of multiple cells was calculated on a per-field of view basis. Bars represent average ± s.e.m. n ≥16 fields of view containing ≥100 cells each. Gaussian distribution; Bonferroni’s multiple comparison test; α = 0.05; *P < 0.05; ***P < 0.0001. (F) Evaluation of wild-type and T17N mutant Cdc42-2G biosensors in REF52 fibroblasts. ER (top) and biosensor distribution (donor channel; bottom) are shown. (G) Fluorescence intensity and ER profiles across lines shown in (F). ERs are scaled identically in both cells. Scale bar: (F) 10 μm.
