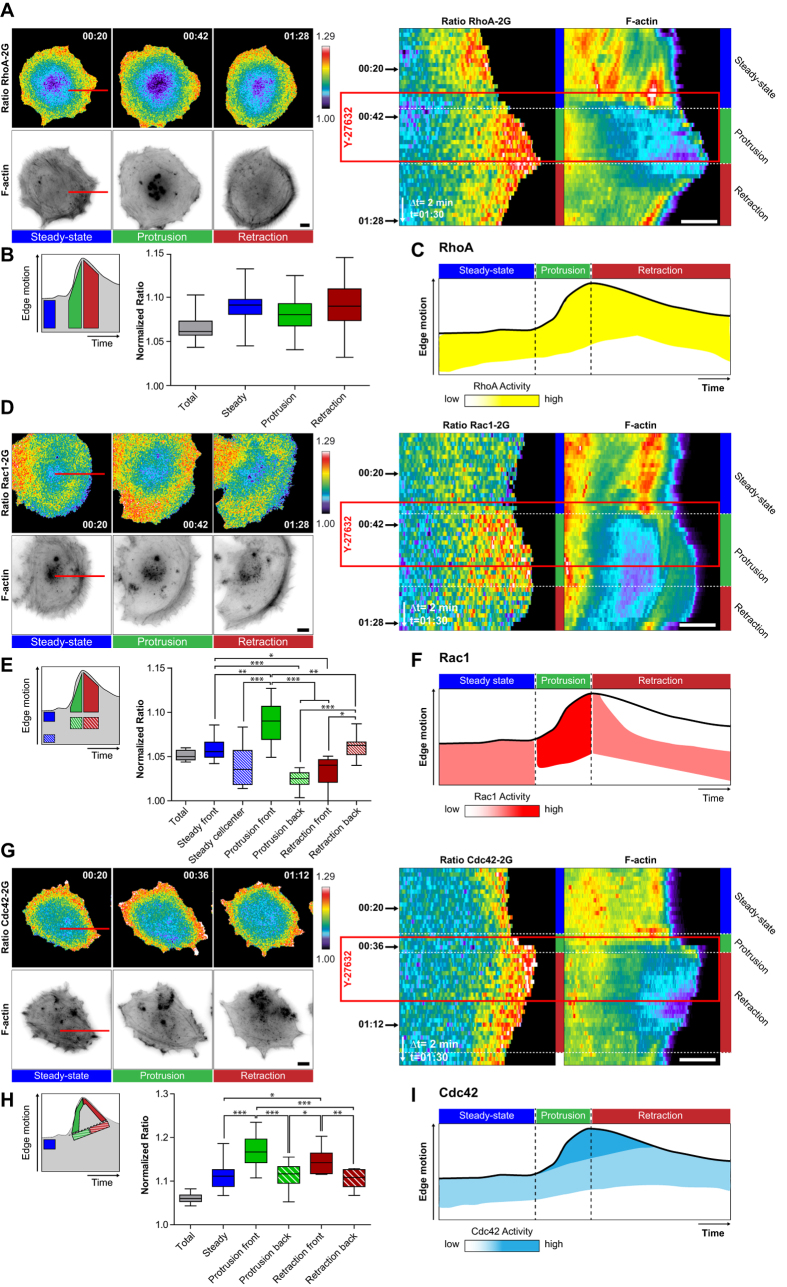
Figure 5. Y-27632 pulse-induced spatio-temporal Rho GTPase activation dynamics.
Legend identical to Fig. 4. (A,D,G) Spatio-temporal RhoA (A), Rac1 (D) and Cdc42 (G) activation simultaneously measured with F-actin dynamics. (B,E,H) Quantification of Rho GTPase signaling states. Total averaged ERs (grey box) were not included in statistical analysis; RhoA: n = 6 cells, 11 to 20 measurements per dynamic event, Rac1: n = 5 cells, 10 to 11 measurements per dynamic event, Cdc42: n = 6 cells 13 to 17 measurements per dynamic event. Non-gaussian distribution, Kruskal-Wallis test followed by Dunn’s multiple comparison post-test; α = 0.05; *P < 0.05, **P < 0.001, ***P < 0.0001. Non-indicated pairs show no significance. (C,F,I) Schematic representation of RhoA (C), Rac1 (F) and Cdc42 (I) activation patterns related to edge dynamics.

