
Figure 3. Blood clearance and organ distribution of LO1-750.
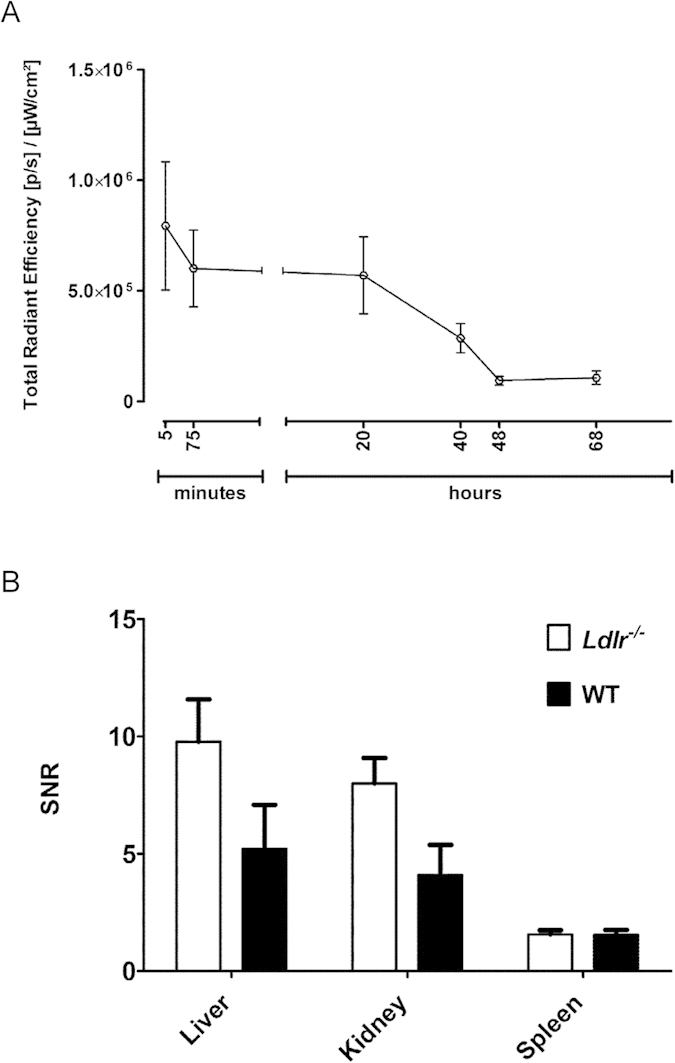
(A) Shows the clearance from the blood of LO1-750 as determined by serial bleeds of Lldr−/− and WT mice (n = 3/group). There was no difference in clearance between the two groups, and data points are mean + SEM from the mice combined. The clearance displayed a two-phase decay pattern with a fast and a slow phase. The overall half-life (t1/2) of LO1-750 in the circulation was estimated at 21 hours; (B) shows equivalent ex vivo organ signal-to-noise ratio (SNR) of LO1-750 in Ldlr−/− and WT mice (n = 4/group) with most of the antibody localizing in liver, kidneys and spleen in both groups. Data points are mean + SEM.