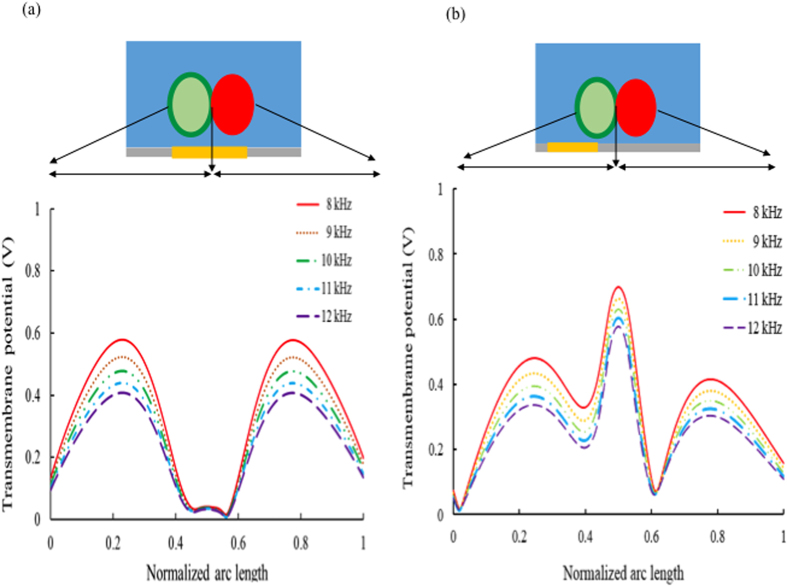
Figure 1. Numerical simulations of the transmembrane potential (20 Vpp).
Different light pattern orientations have been modeled/simulated. (a) The light pattern was aligned towards the cell-cell interface. As the AC electrical field was applied, the maximum transmembrane potential occurred at the tops and bottoms of the cells. However, the transmembrane potential of the cell-cell contact area was not sufficient to induce cell fusion. (b) The light pattern was moved away from the cell at a distance of one cell radius. The electric field lines then passed through the cell contact area from the first cell to the second cell. Therefore, the maximum transmembrane potential was induced at the cell contact area. Maximum values ranging from 0.58 to 0.72 V were observed as the AC electric frequency was decreased from 12 to 8 kHz.

