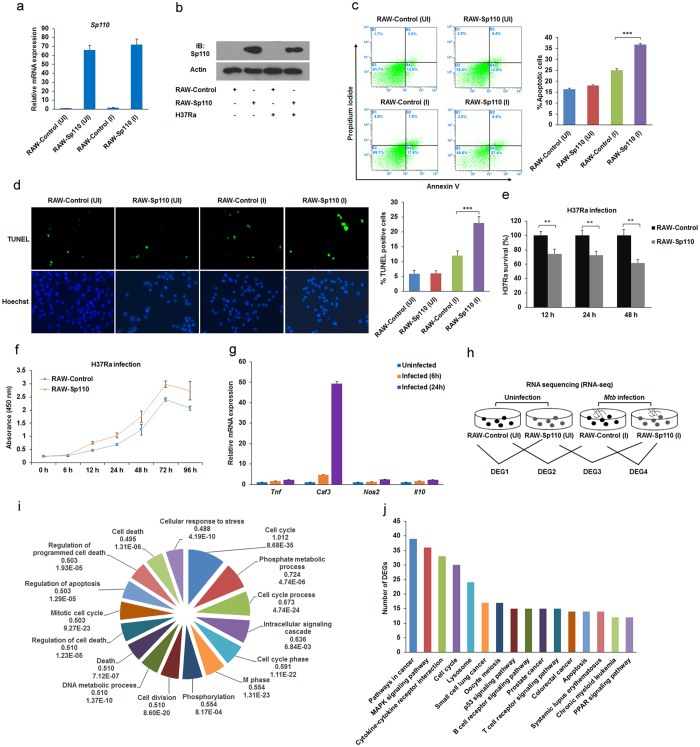
Figure 1. Transcriptional changes in mouse macrophages in response to Mtb infection.
RAW-Control and RAW-Sp110 cells were infected with H37Ra at a multiplicity of infection (MOI) of 5:1 for 24 h, and Sp110 expression was determined by qPCR (a) or immunoblotting (b). RAW-Control and RAW-Sp110 cells were infected with H37Ra (MOI 5:1) for 24 h. Apoptotic cells were evaluated by Annexin-V staining followed by flow cytometric analysis (c) or a TUNEL assay (d). (e) RAW-Control and RAW-Sp110 cells were infected with H37Ra. Intracellular mycobacterial burden was determined at the time points indicated by a CFU assay. (f) The viabilities of the H37Ra-infected RAW-Control and RAW-Sp110 cells were determined by a cell proliferation assay. (g) RAW-Control and RAW-Sp110 cells were infected with H37Ra, and Tnf, Csf3, Nos2 and Il10 expression was determined by qPCR at the time points indicated. Data represent the mean ± SD of three independent experiments. **p < 0.01; ***p < 0.001. (h) Differentially expressed genes (DEGs) were screened as the groups indicated. UI, uninfected cells; I, H37Ra infected cells. (i) Gene Ontology (GO) analysis of H37Ra-regulated genes. Pie chart of the enriched biological processes generated from DEGs of DEG2. The top-ranked GO terms are presented according to the enriched gene counts, and the values below each term represent the ratio of DEGs versus the total gene set for each functional category and the P value. (j) Kyoto Encyclopedia of Genes and Genomes (KEGG) pathway analysis of H37Ra-regulated genes. The top-ranked pathways were plotted according to the DEG numbers. The complete GO and KEGG analysis data are shown in Table S2. The full-length blots are shown in Supplementary Figure 1.

