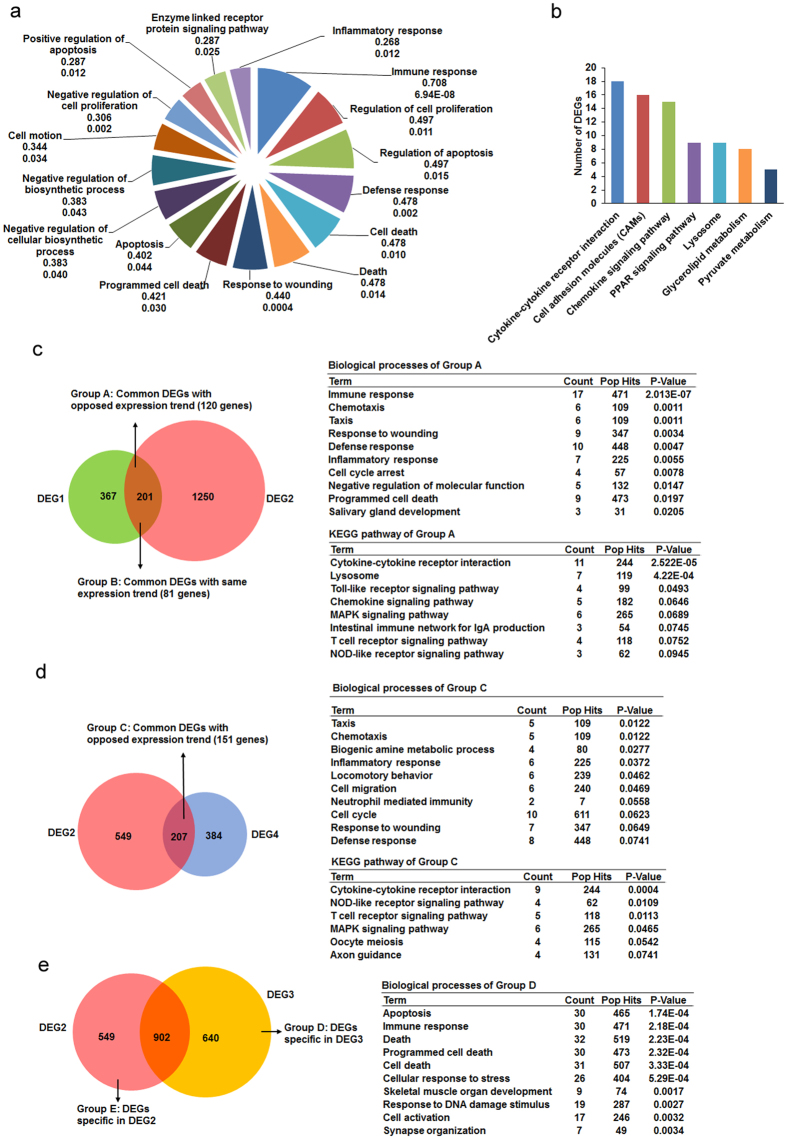
Figure 2. Functional annotation of Sp110-regulated genes.
(a) GO analysis of Sp110-regulated genes. Pie chart of the enriched biological processes generated from the differentially expressed genes (DEGs) of DEG1. The top-ranked GO terms are presented according to the enriched gene counts, and the values below each term represent the ratio of DEGs versus the total gene set for each functional category and the P value. (b) KEGG pathway analysis of DEGs from DEG1. The top-ranked pathways were plotted according to the DEG numbers. (c) Comparison of DEGs from DEG1 and DEG2. The common DEG count between DEG1 and DEG2 with the same or opposite expression trend is shown in the left panel, and functional annotation of the group A DEGs is shown in the right panel. (d) Comparison of DEGs from DEG2 and DEG4. The common DEG count between DEG2 and DEG4 with an opposite expression trend is shown in the left panel, and functional annotation of these DEGs is shown in the right panel. (e) Comparison of DEGs from DEG2 and DEG3. The number of DEGs specific to DEG2 or DEG3 (left), and functional annotation of the DEGs specific to DEG3 (right), are provided. The complete GO and KEGG analysis data are shown in Tables S5–7.

