
Figure 3. Comparisons between the behaviours of bees in the control and Nosema treatments.
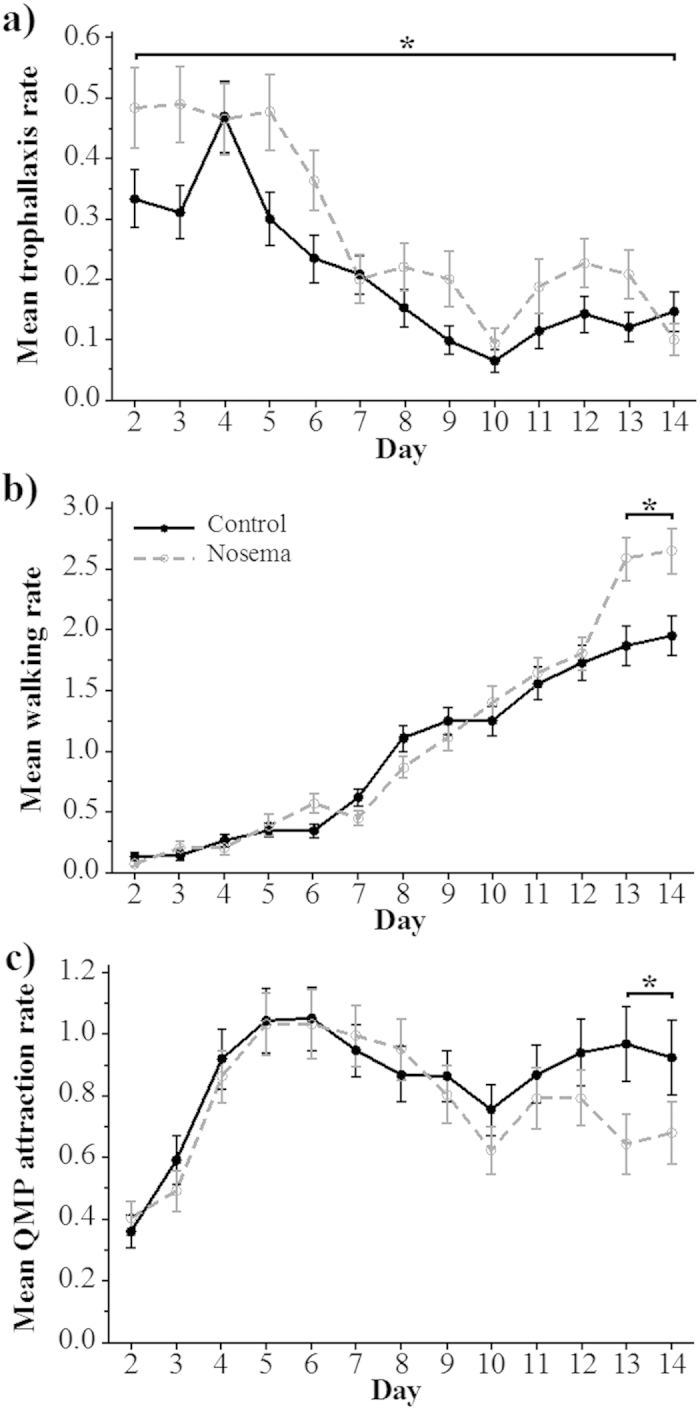
Mean daily rates (standard error bars shown) for (a) trophallaxis, (b) walking and (c) QMP attraction behaviours in control and Nosema-treated groups of honey bees. Significant contrast test differences are indicated with an asterisk.