. 2015 Sep 29;14(1):149–157. doi: 10.1039/c5ob01681a

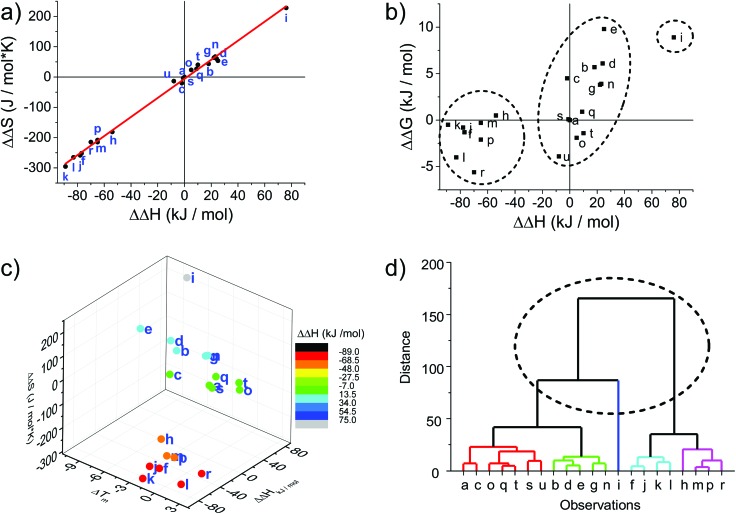
Fig. 1. Thermodynamic plots of the porphyrin-LNA duplexes. Data are taken from Table 1. (a) Enthalpy–entropy compensation with linear regression [ΔΔS = –5.88 + (3.15 K)ΔΔH; R2 = 0.996]. (b) Correlation between ΔΔH and ΔΔG 298 demonstrating that there is a linear correlation between ΔΔG and ΔΔH.66 (c) Enthalpy–entropy-change in ΔT m correlation showing further clustering when compared to net change of entropy. (d) Hierarchical analysis using the euclidean distance carried out by OriginLab software presenting five clusters of duplex samples. The dashed circle indicates the classification of the three groups identified in (a), (b) and (c); the main groups can be further divided into five major subgroups.

Fig. 1