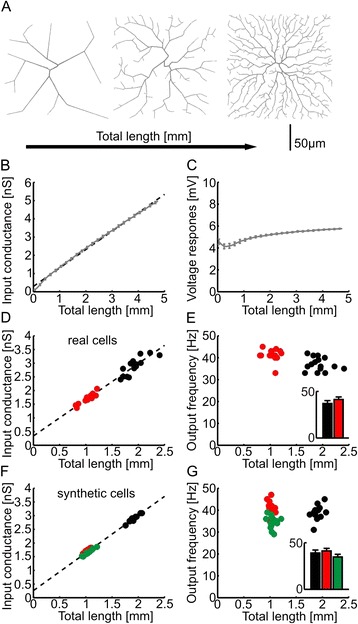
Fig. 4.

Morphological models reveal the general electrotonic principle leading to the homeostatic regulation of excitability. a Representative simplified morphological models (grey) with increasing complexity of dendrites. b Change of input conductance with total dendrite length in the simplified morphological models (grey line) with linear fit (dashed line). Single values were averaged in 100 μm sized bins. c Resulting somatic membrane potential deflection when activating all synapses, as a function of total dendrite length (grey line). An average was performed as in b. Synapses were distributed 1 per node and nodes were 1 μm apart. d) Input conductance vs. total dendrite length measurements in denervated (red) and control black granule cell reconstructions with linear fit (dashed line). e Corresponding firing rate of the cells when all dendritic synapses are activated at 0.5 Hz. The output frequency is plotted versus total dendrite length and summary graph in inset. The same distribution and number of synapses was used as in Fig. 1f. f , g Same as d , e but in synthetic cells from Fig. 2. On average 5634, 3032 and 3085 synapses were inserted in synthetic control, denervated OML and denervated IML cells, respectively
