
Fig. 5.
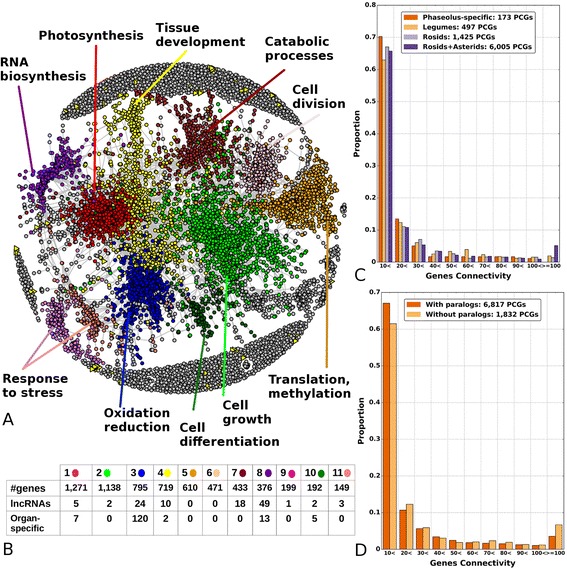
Co-expression network. a Co-expression network layout; the 11 largest modules are colored differently, and labeled with their putative function. b Composition of the largest modules in the co-expression network (number of PCGs and lncRNAs, and of organ-specific genes). Colors correspond to those in the network in (a). c Gene connectivity as a function of evolutionary age. d Gene connectivity as a function of presence/absence of paralogs