Fig. 9.

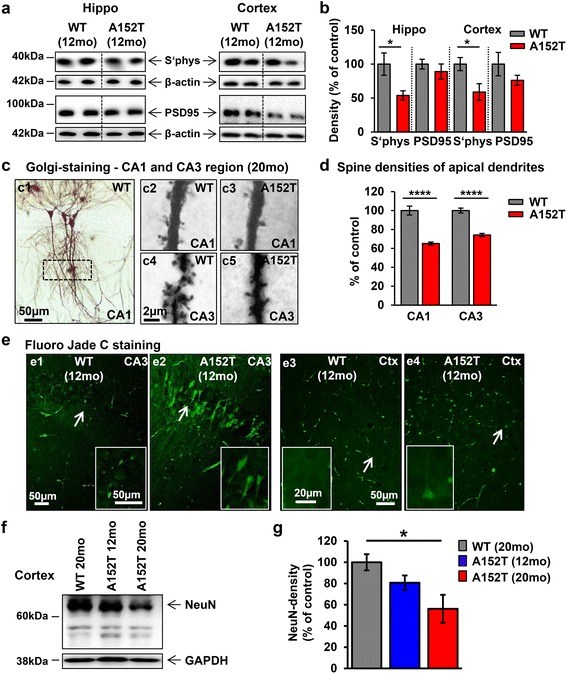
Synapse loss and neurodegeneration in hTau40AT mice. a Western blots of hippocampus and cortex extracts showing expression levels of synaptic proteins (synaptophysin and PSD-95) of 12 months old hTau40AT and WT mice. β-actin serves as loading control. Decreased levels of pre-synaptic (synaptophysin) and post-synaptic (PSD-95) markers are detected in hTau40AT mice compared to WT. b Quantification of (a), normalized to ß-actin. Red bars indicate a reduction of pre-synaptic (synaptophysin) and postsynaptic (PSD-95) markers in hTau40AT mice. Bars show mean ± SEM; n = 5. Statistics: two-sided t test indicates significant differences between WT and hTau40AT mice (*:p < 0.05). c Dendritic spine density analyzed by Golgi-staining. (c1) Overview of Golgi-stained CA1 neurons of WT mouse with highlighted region of interest (box). (c2-c5) Higher magnification of CA1 and CA3 apical dendrites of hTau40AT mice compared to WT at 20 months of age. Scale bar c1, 50 μm; c2-5, 2 μm. d Quantification of (c). A highly significant reduction of dendritic spines is detected in 20 months old hTau40AT mice (red bar, CA1: ~35 %; CA3: ~25 %) compared to WT mice (grey bars). Bars show mean values ± SEM; n = 2-3 mice per group. Statistics: two-sided t test, ****:p < 0.0001. e Fluoro Jade C staining of floating sections from 12 months old hTau40AT and WT mice to visualize neurodegenerative processes. Note the intense neurodegeneration in the CA3 region (e2) and cortex of hTau40AT mice (e4) compared to WT mice (e1, e3). Arrows in the overviews indicate the location of higher magnified neurons (inserts). f Western blots of cortex extracts show NeuN expression levels in 12 and 20 months old hTau40AT and WT mice. GAPDH serves as loading control. Note the dramatic loss of NeuN (especially ~66 kDa) in 20 months old hTau40AT mice compared to 12 months old hTau40AT and 20 months old WT mice. g Quantification of (f), normalized to GAPDH. Red bar indicates neuronal loss of ~40 % in 20 months old hTau40AT mice compared to age-matched WT mice. Data represent mean values ± SEM; n = 4. Statistical comparisons were accomplished by one-way ANOVA followed by a post hoc Newman-Keuls multiple comparison test using Prism 5.0 (GraphPad Software). Asterisk indicates significant difference between WT and 20 months old hTau40AT mice (*:p < 0.05). WT: wildtype; A152T: hTau40AT transgenic mouse strain; CA: cornu ammonis; Ctx: cortex; mo: months; Scale bars: 2 μm (c2-5), 20 μm (inserts of e3-4), 50 μm (e1-4; inserts of e1-2)
