Fig. 1.

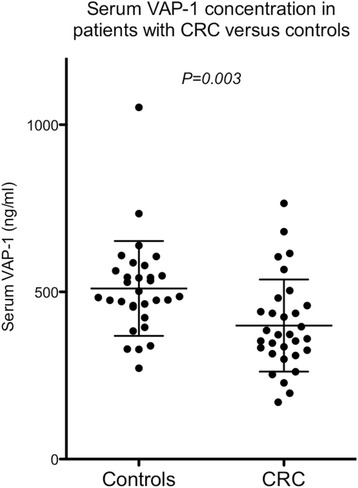
Serum VAP-1 (sVAP-1) levels measured in patients with CRC and controls. The bars indicate the mean ± one standard deviation. Differences between groups were tested for statistical significance using a two-tailed unpaired t-test

Serum VAP-1 (sVAP-1) levels measured in patients with CRC and controls. The bars indicate the mean ± one standard deviation. Differences between groups were tested for statistical significance using a two-tailed unpaired t-test