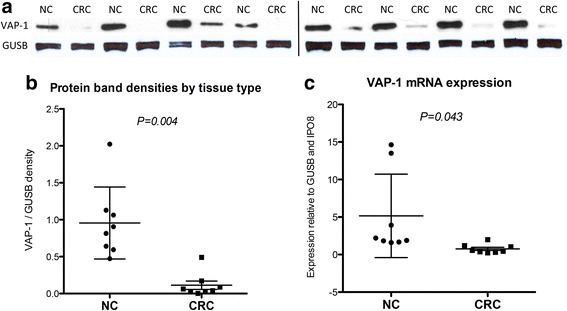
Fig. 2.

a VAP-1 protein expression by Western blot for 8 normal colon (NC) and matched CRC samples. The vertical black line indicates separate gels. b Protein band densitometry of VAP-1/GUSB shows a statistically significant reduction in VAP-1 protein expression in CRC tissue compared with matched colon. c VAP-1 gene expression by 8 normal colon and CRC samples shows a statistically significant reduction in VAP-1 mRNA expression in CRC tissues compared with matched colon, relative to GUSB and IPO8 expression. The bars indicate the mean ± one standard deviation. Differences between groups were tested for statistical significance using a two-tailed unpaired t-test
