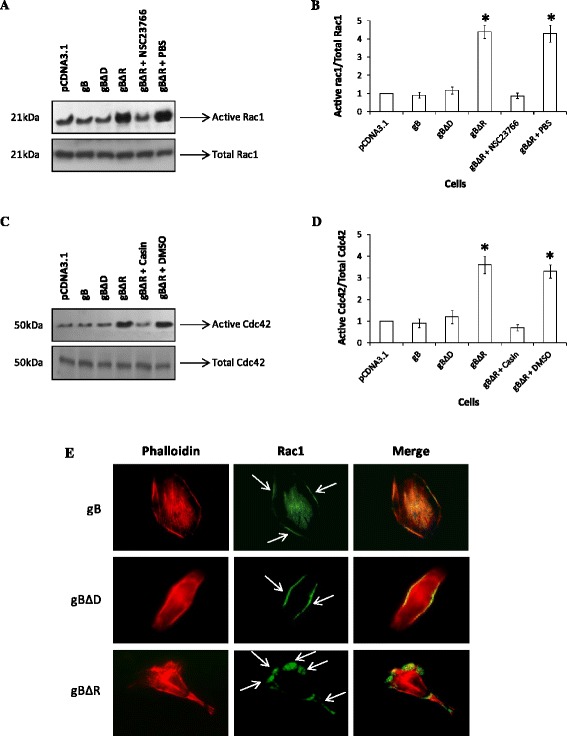
Fig. 5.

Rac1/Cdc42 signaling is induced in cells expressing gBR. Rac1 (a, b) and Cdc42 (c, d) activity was measured using GST-Pak1 pulldown assays in cells expressing gB, gBΔD, and gBΔR in the absence or in the presence of a NSC23766 (Rac1 inhibitor) and Casin (Cdc42 inhibitor). b, d The graph shows densitometric analysis of Rac/Cdc42-GTP levels with respect to input levels of total Rac1/Cdc42 for 5 independent experiments. e Cells expressing different forms of gB were permeabiized and double stained with anti-Rac1 (Green) and phalloidin (Red). The two images were merged to show the co-localization (denoted by arrows). Magnification: x100
