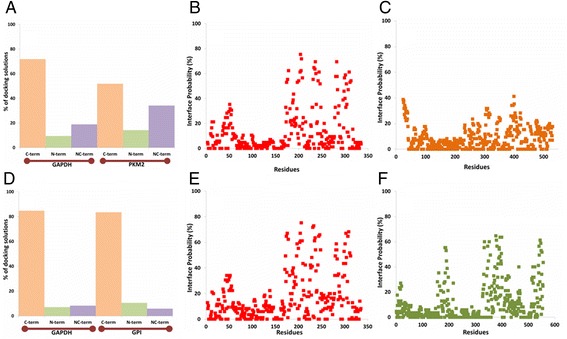
Fig. 4.

Panel a provides the overall occurrence frequencies of C terminal, N terminal, and both NC of GAPDH and PKM2 proteins at the interface observed within the 90 top scoring docking complexes obtained from three different programs whereas panels b (GAPDH) and c (PKM2) provides the occurrence frequency of each residue within the GAPDH-PKM2 docking complexes. Panels d-f represent similar domain and residue occurrence frequencies observed within the GAPDH-GPI docking complexes. An interface is regarded as C or N terminal interface if 60 % of the interface residues for each protein reside within C or N termini, respectively
